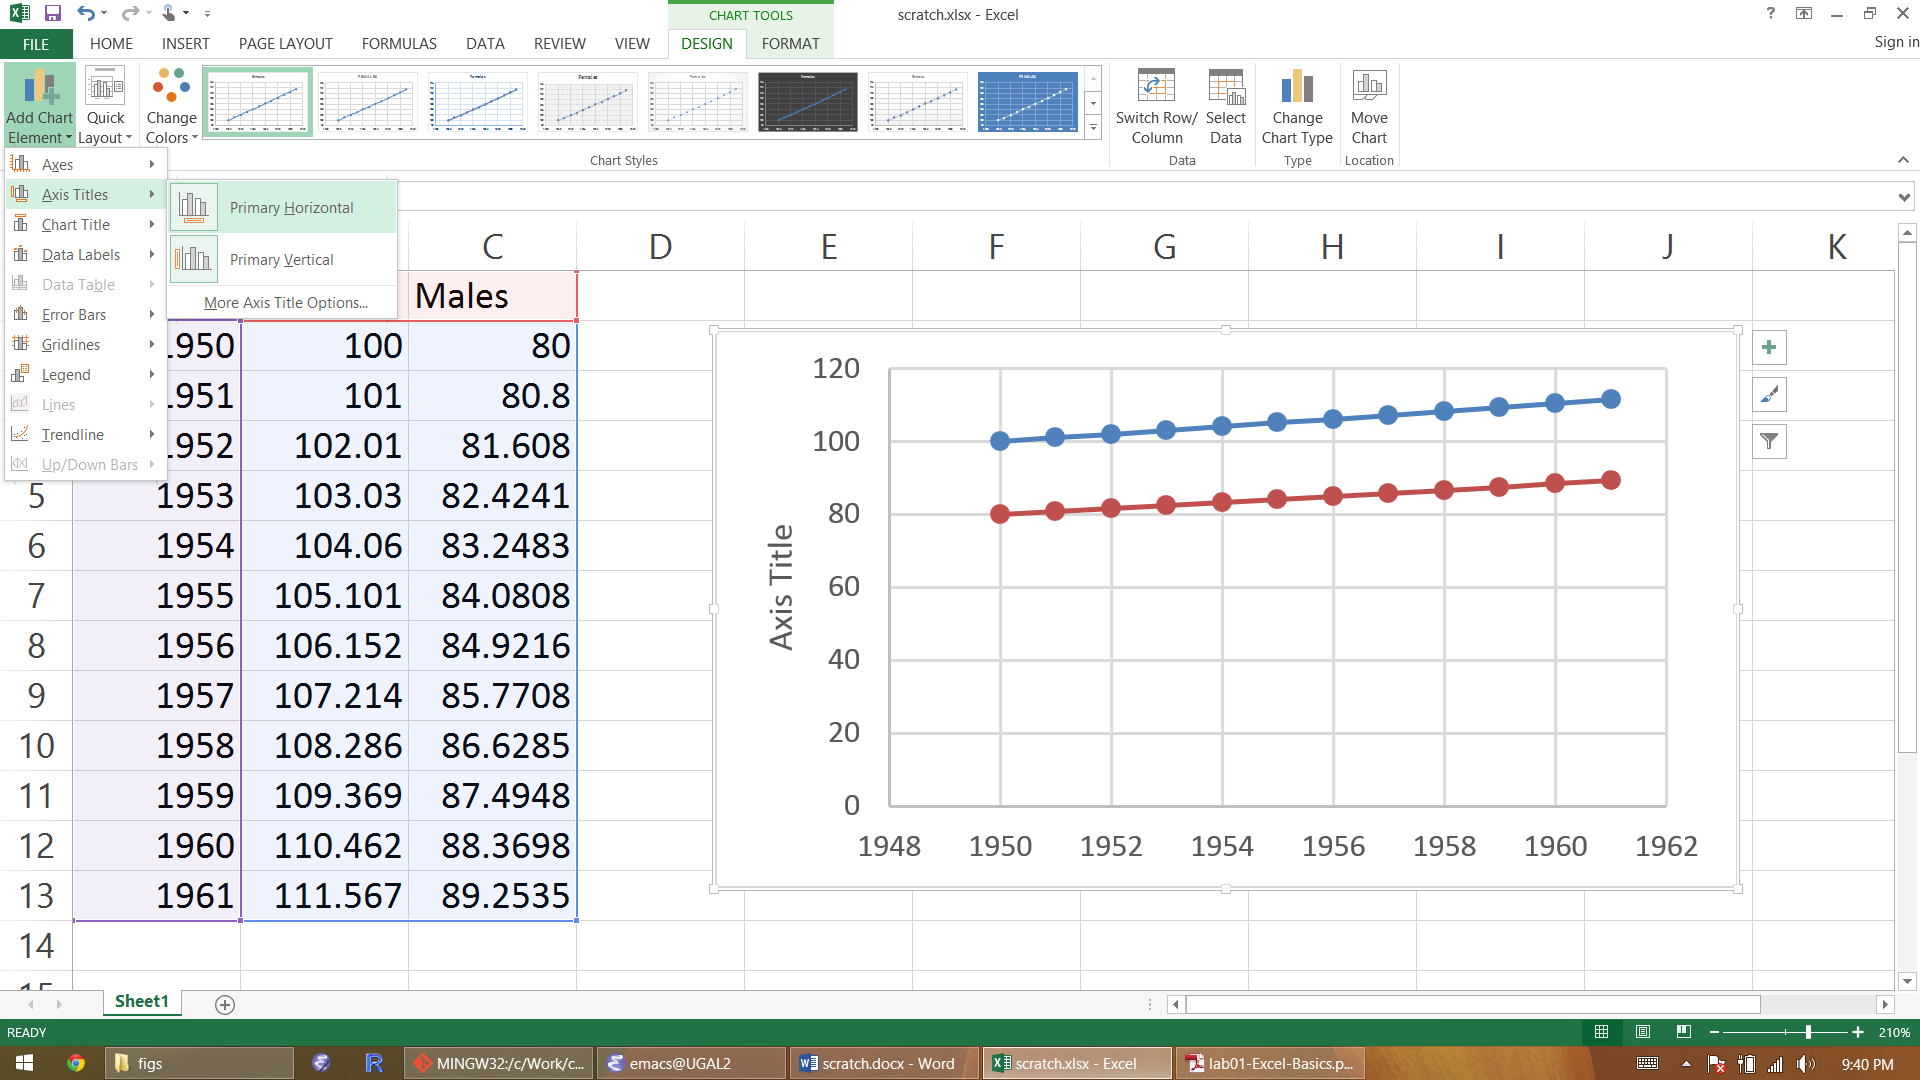
[1] 1950 1951 1952 1953 1954 1955 1956 1957 1958 1959 1960 1961


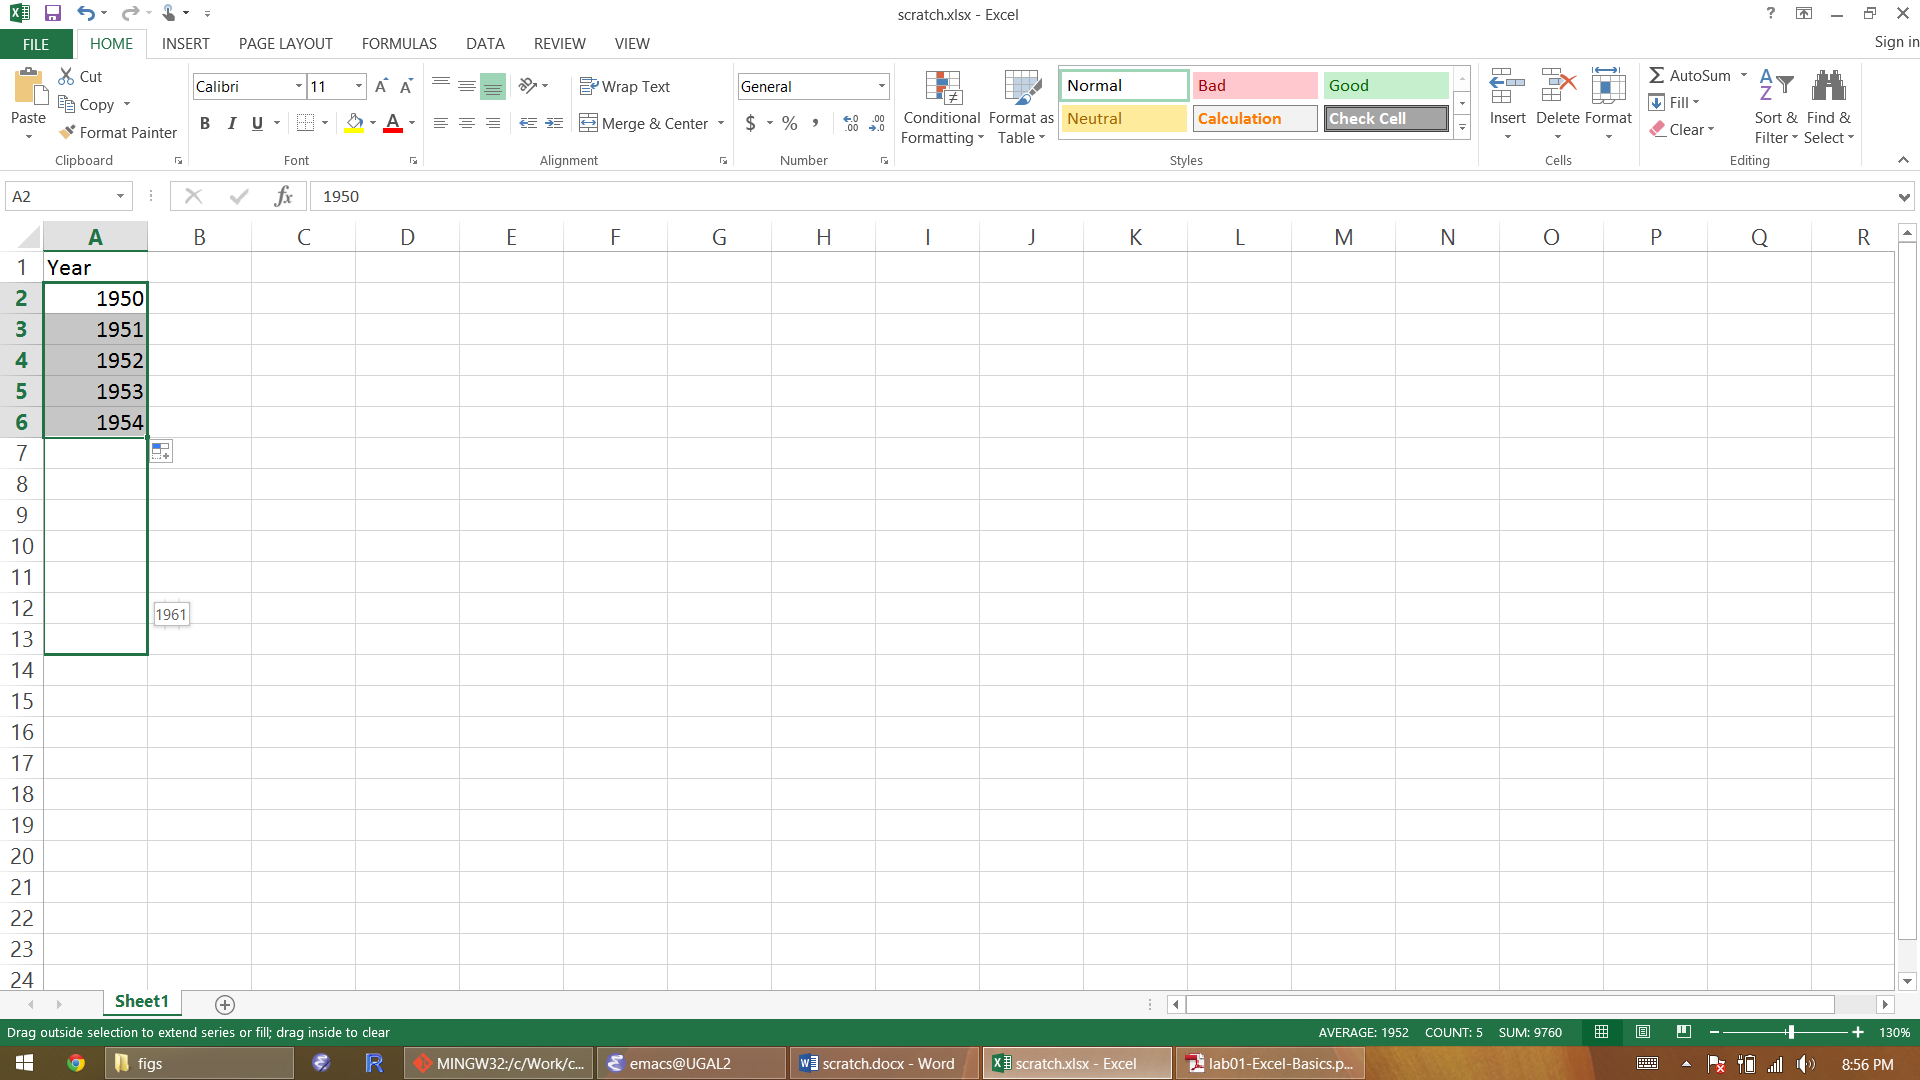
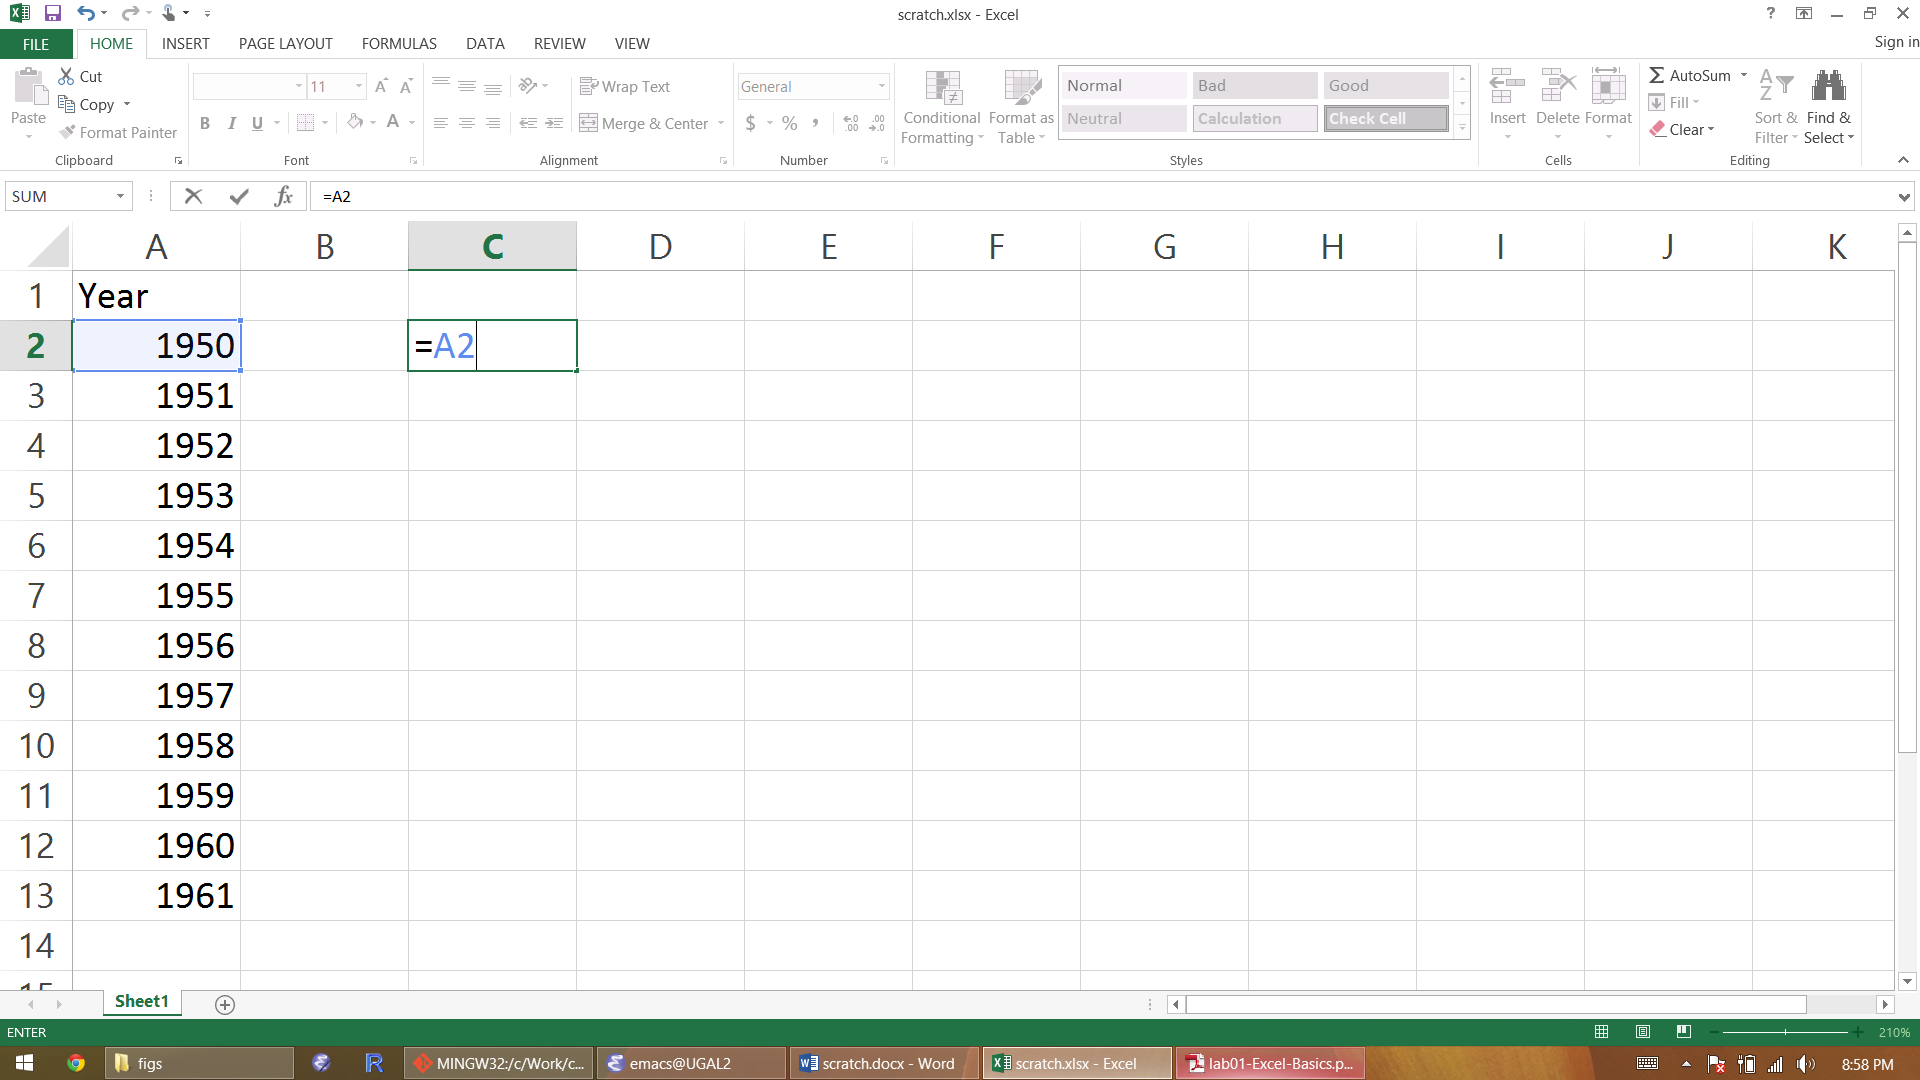
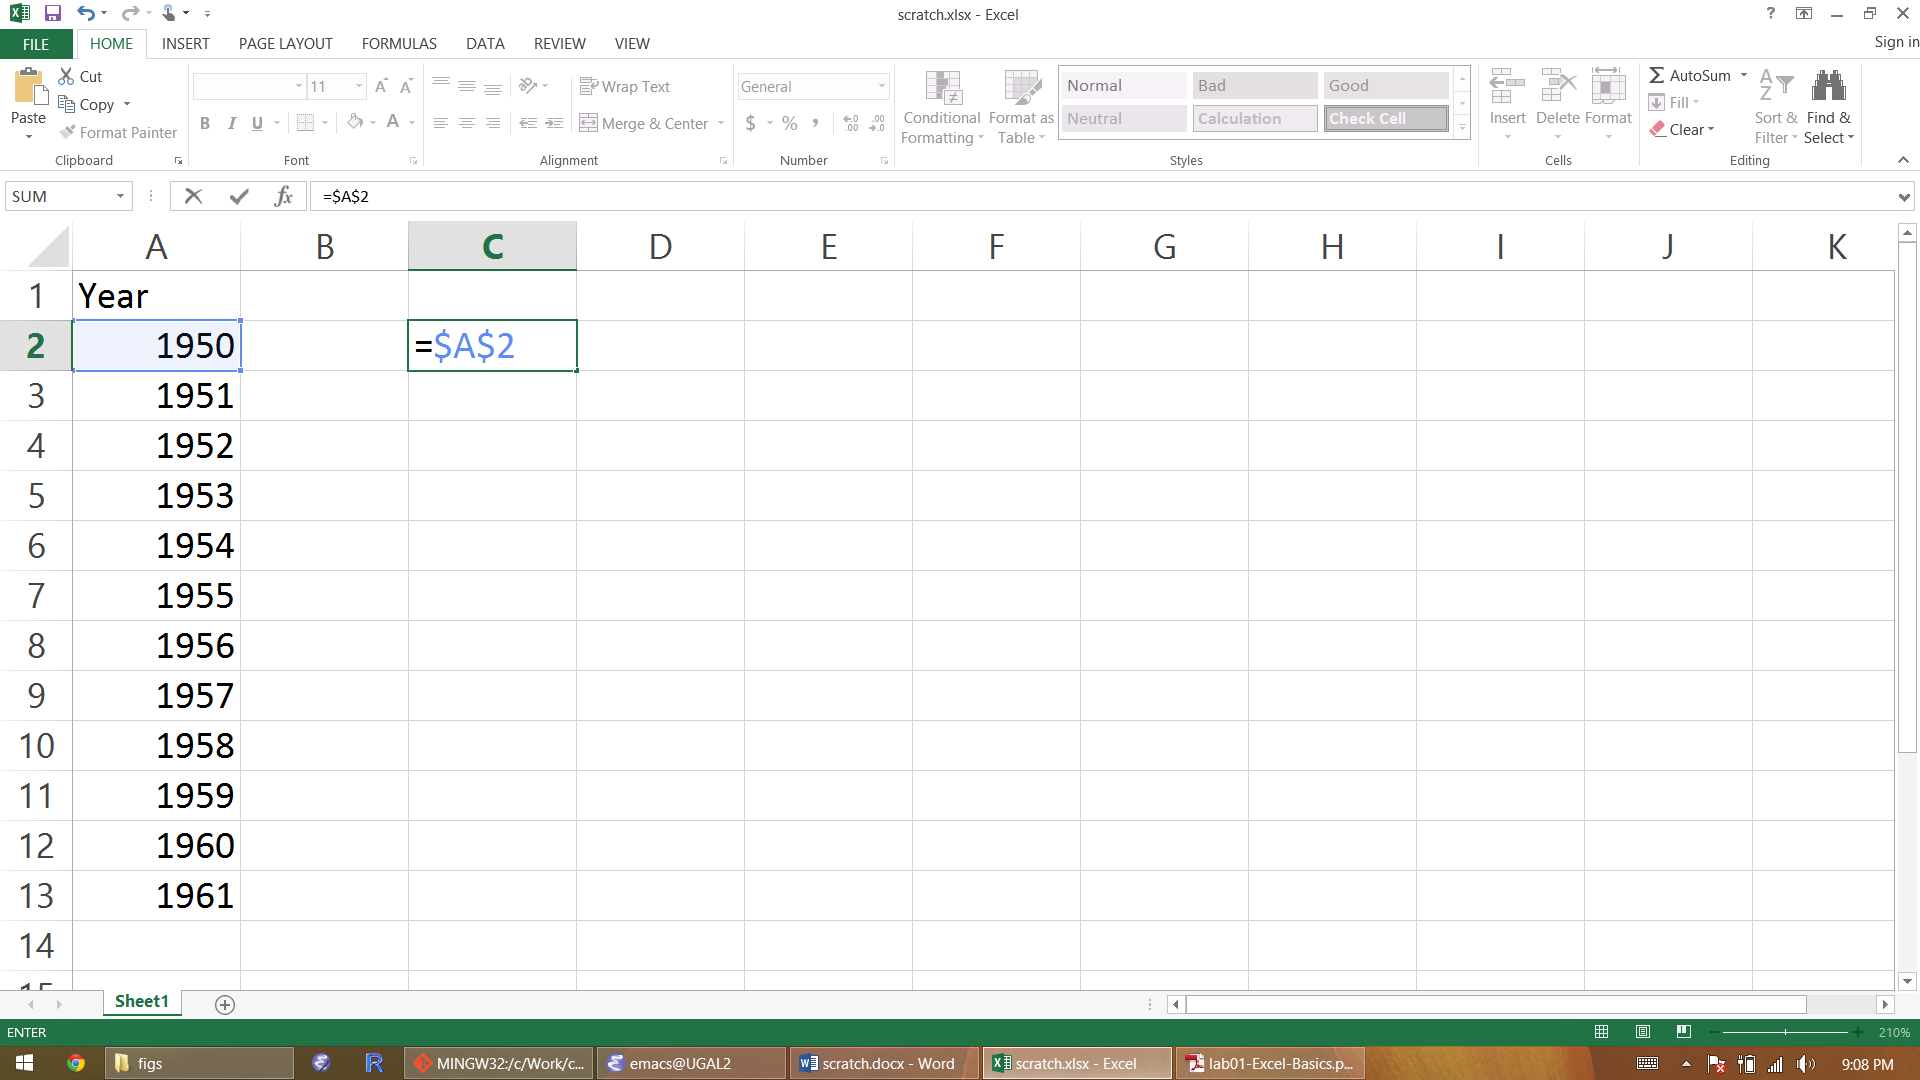
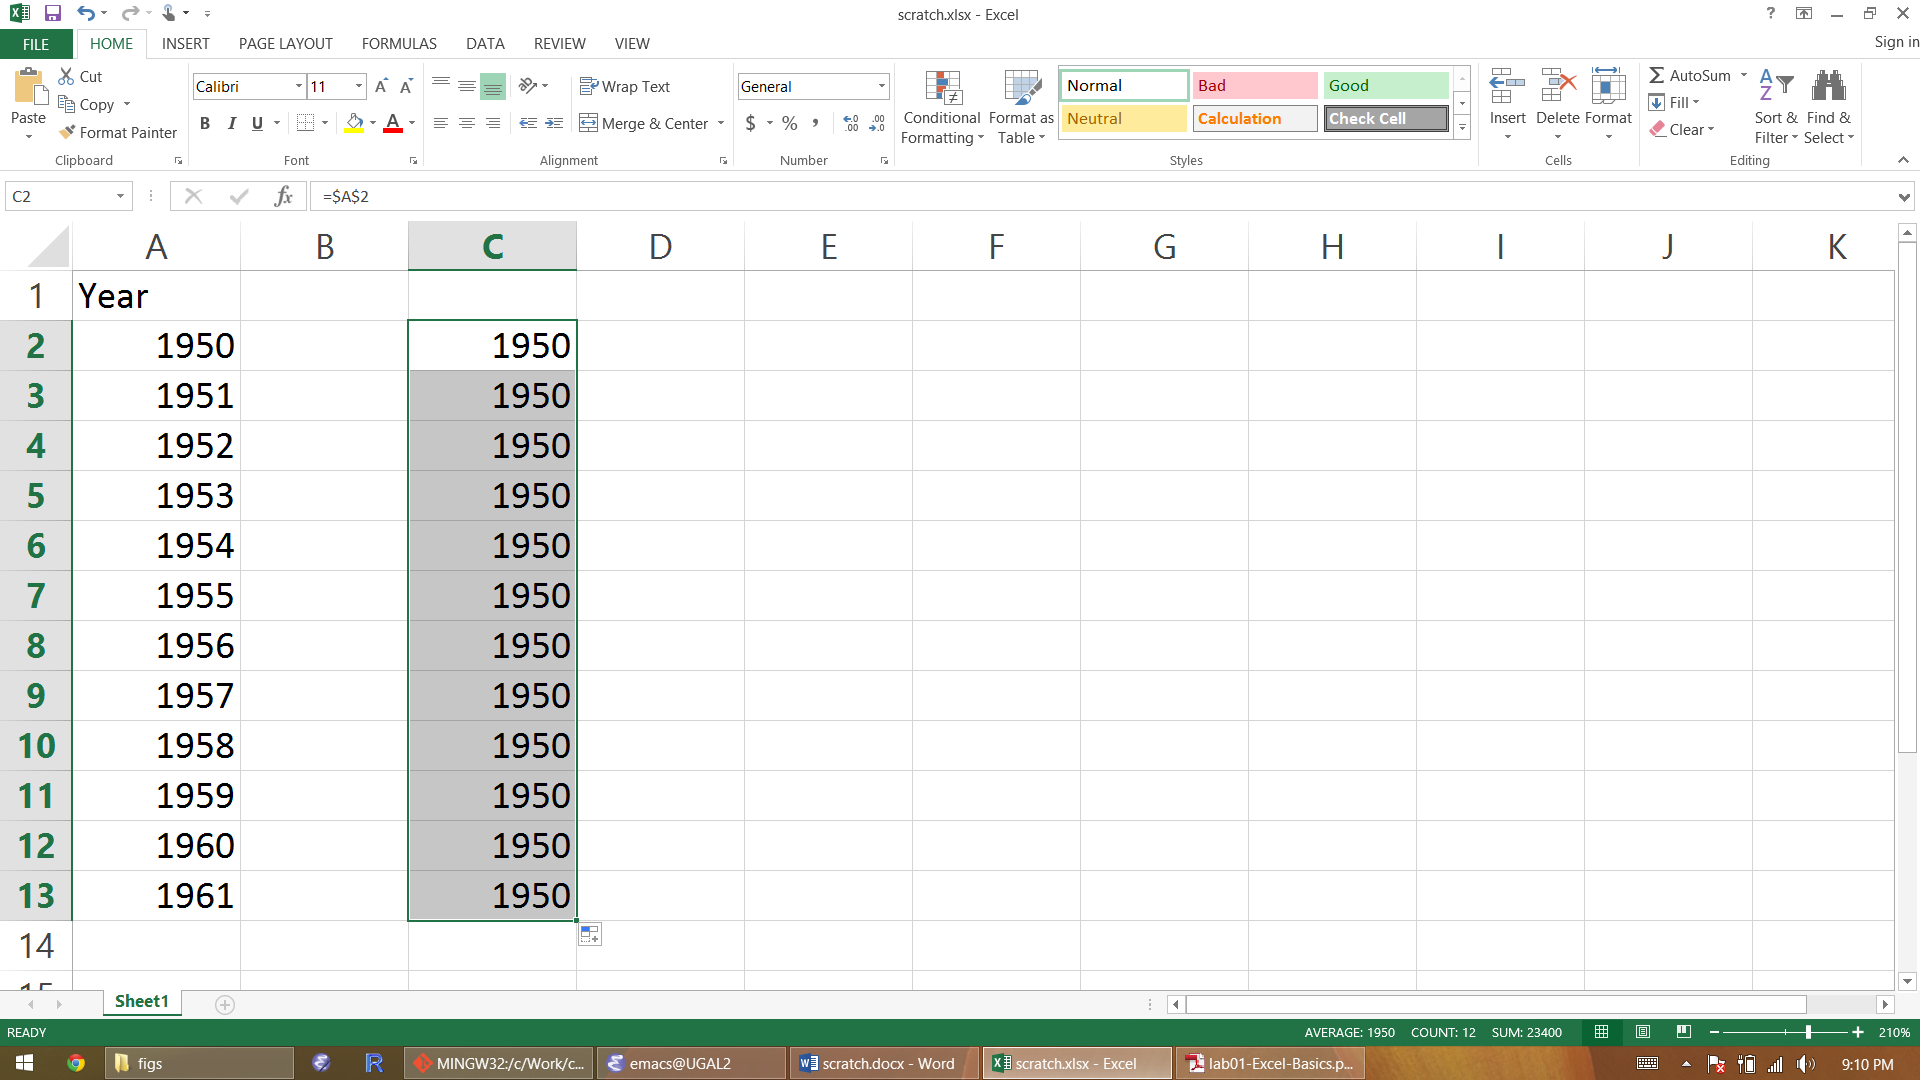
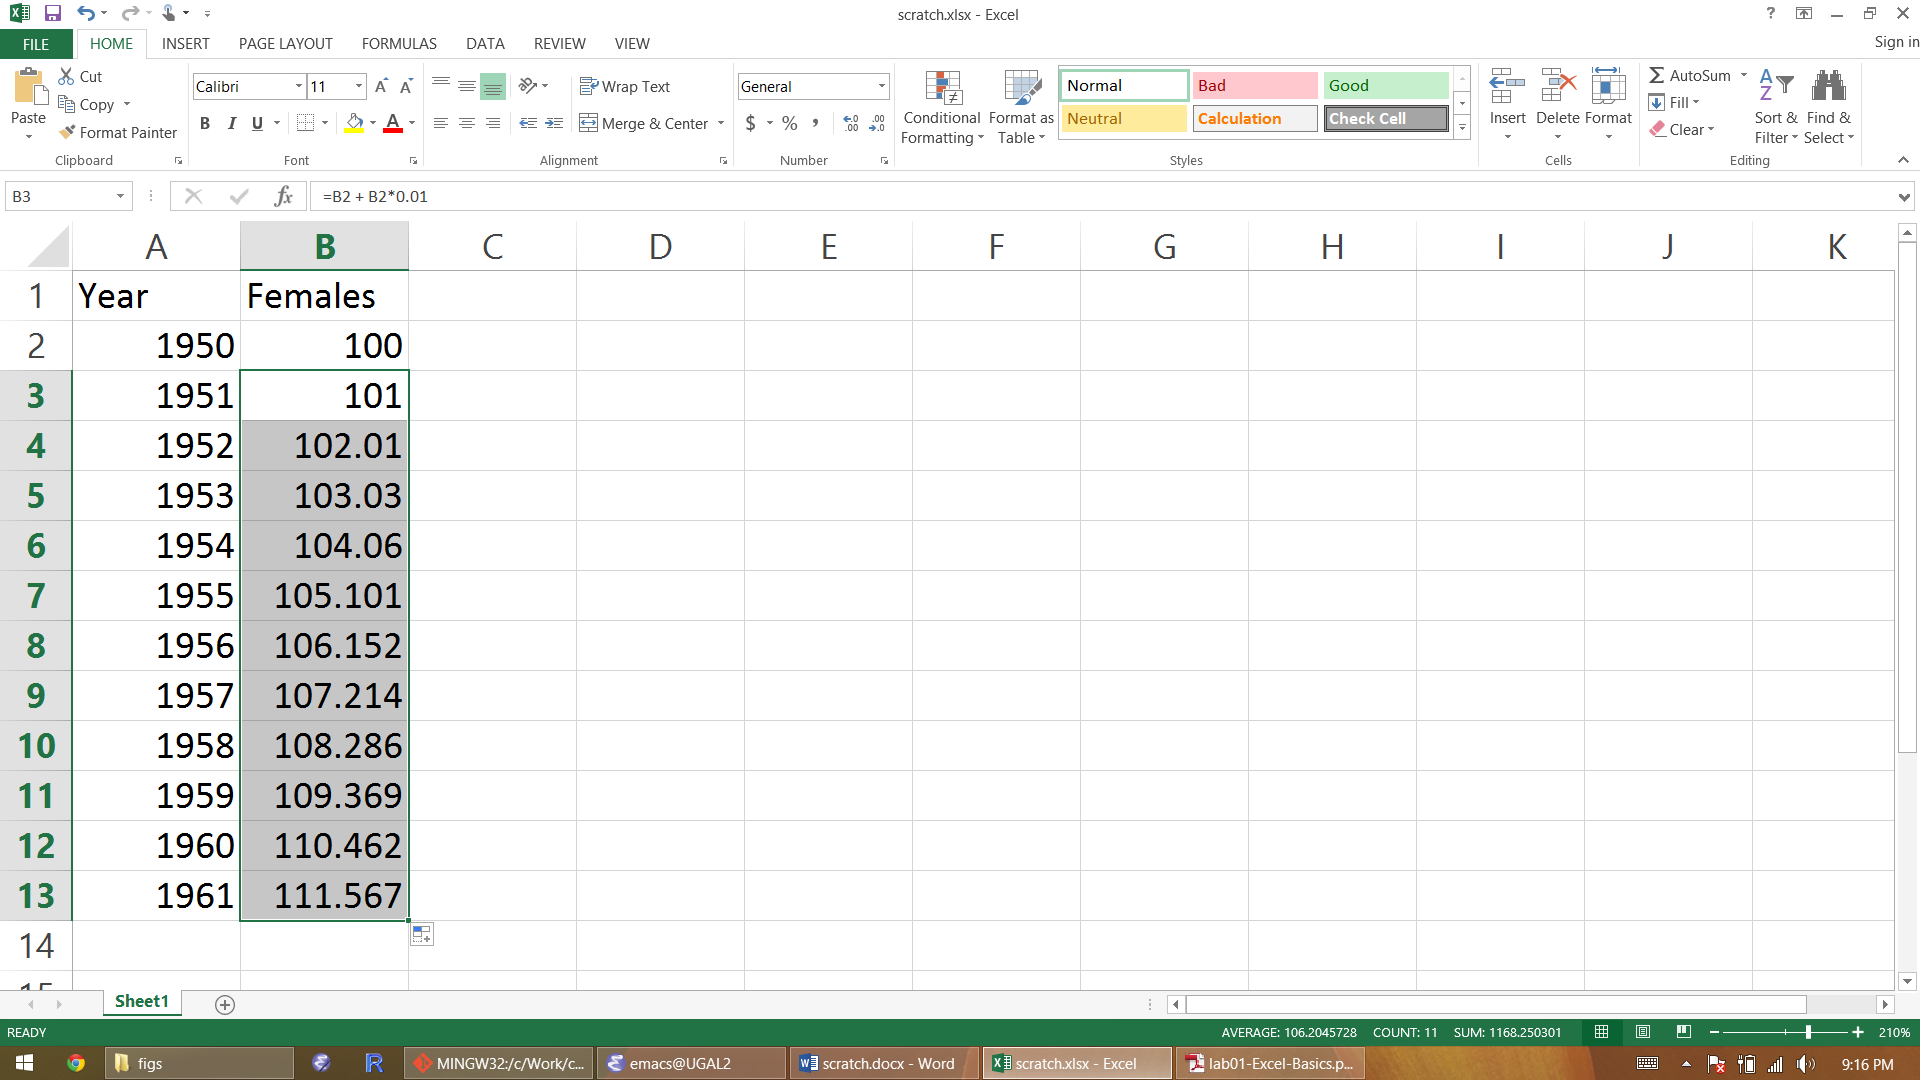
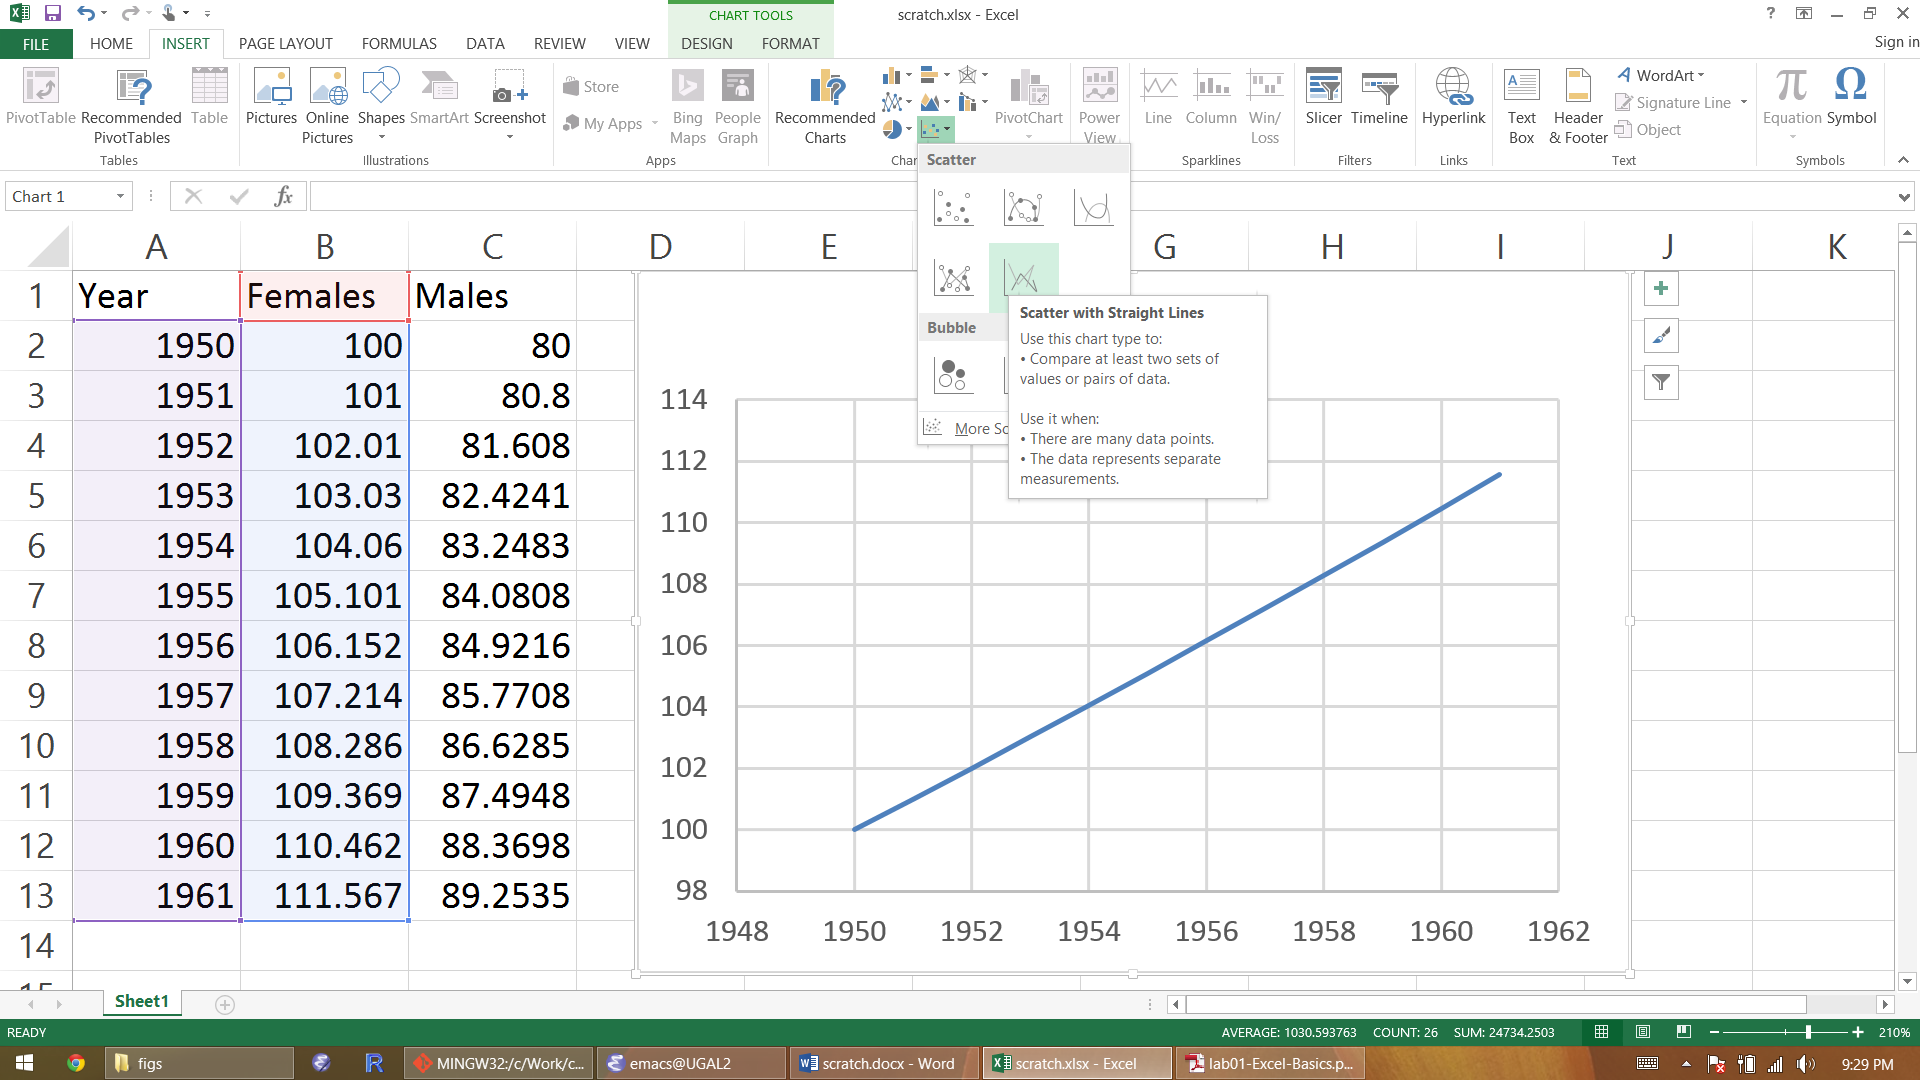
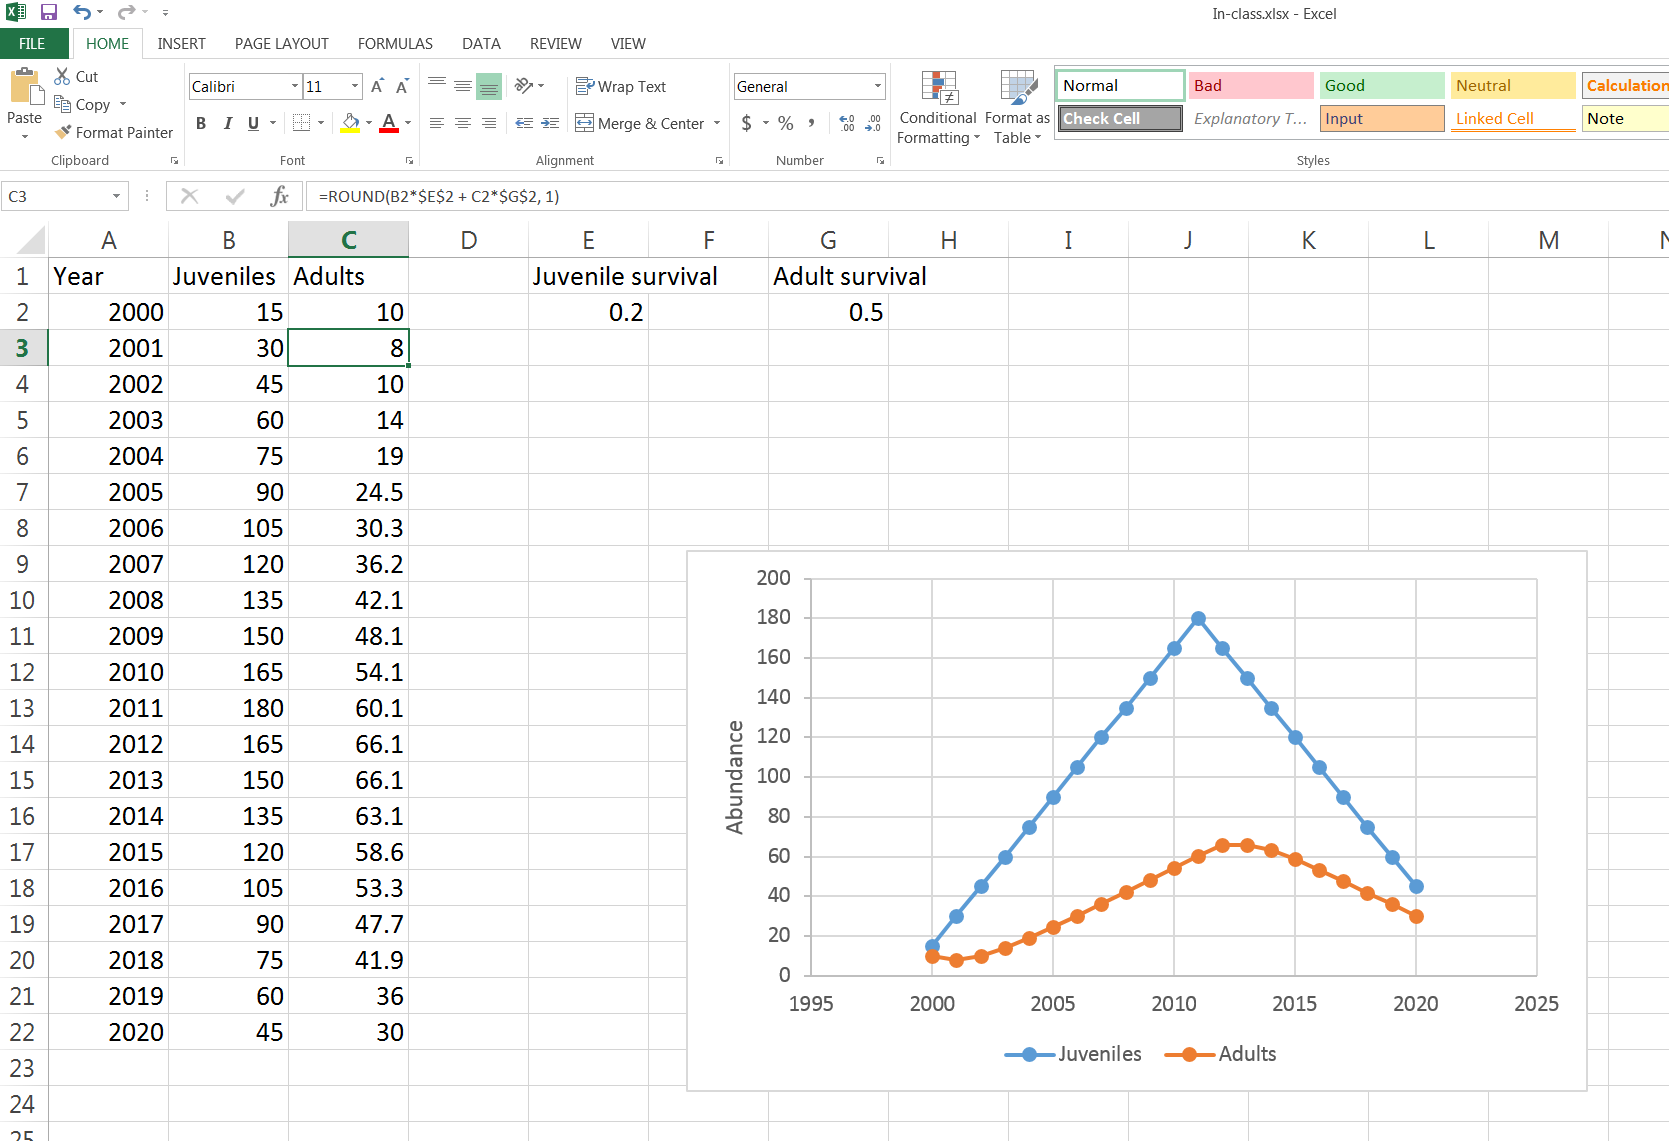
To use auto-fill: begin a sequence, highlight the cells, and then drag the box at the bottom-right of the last cell.


=)


R can be downloaded here: https://www.r-project.org/
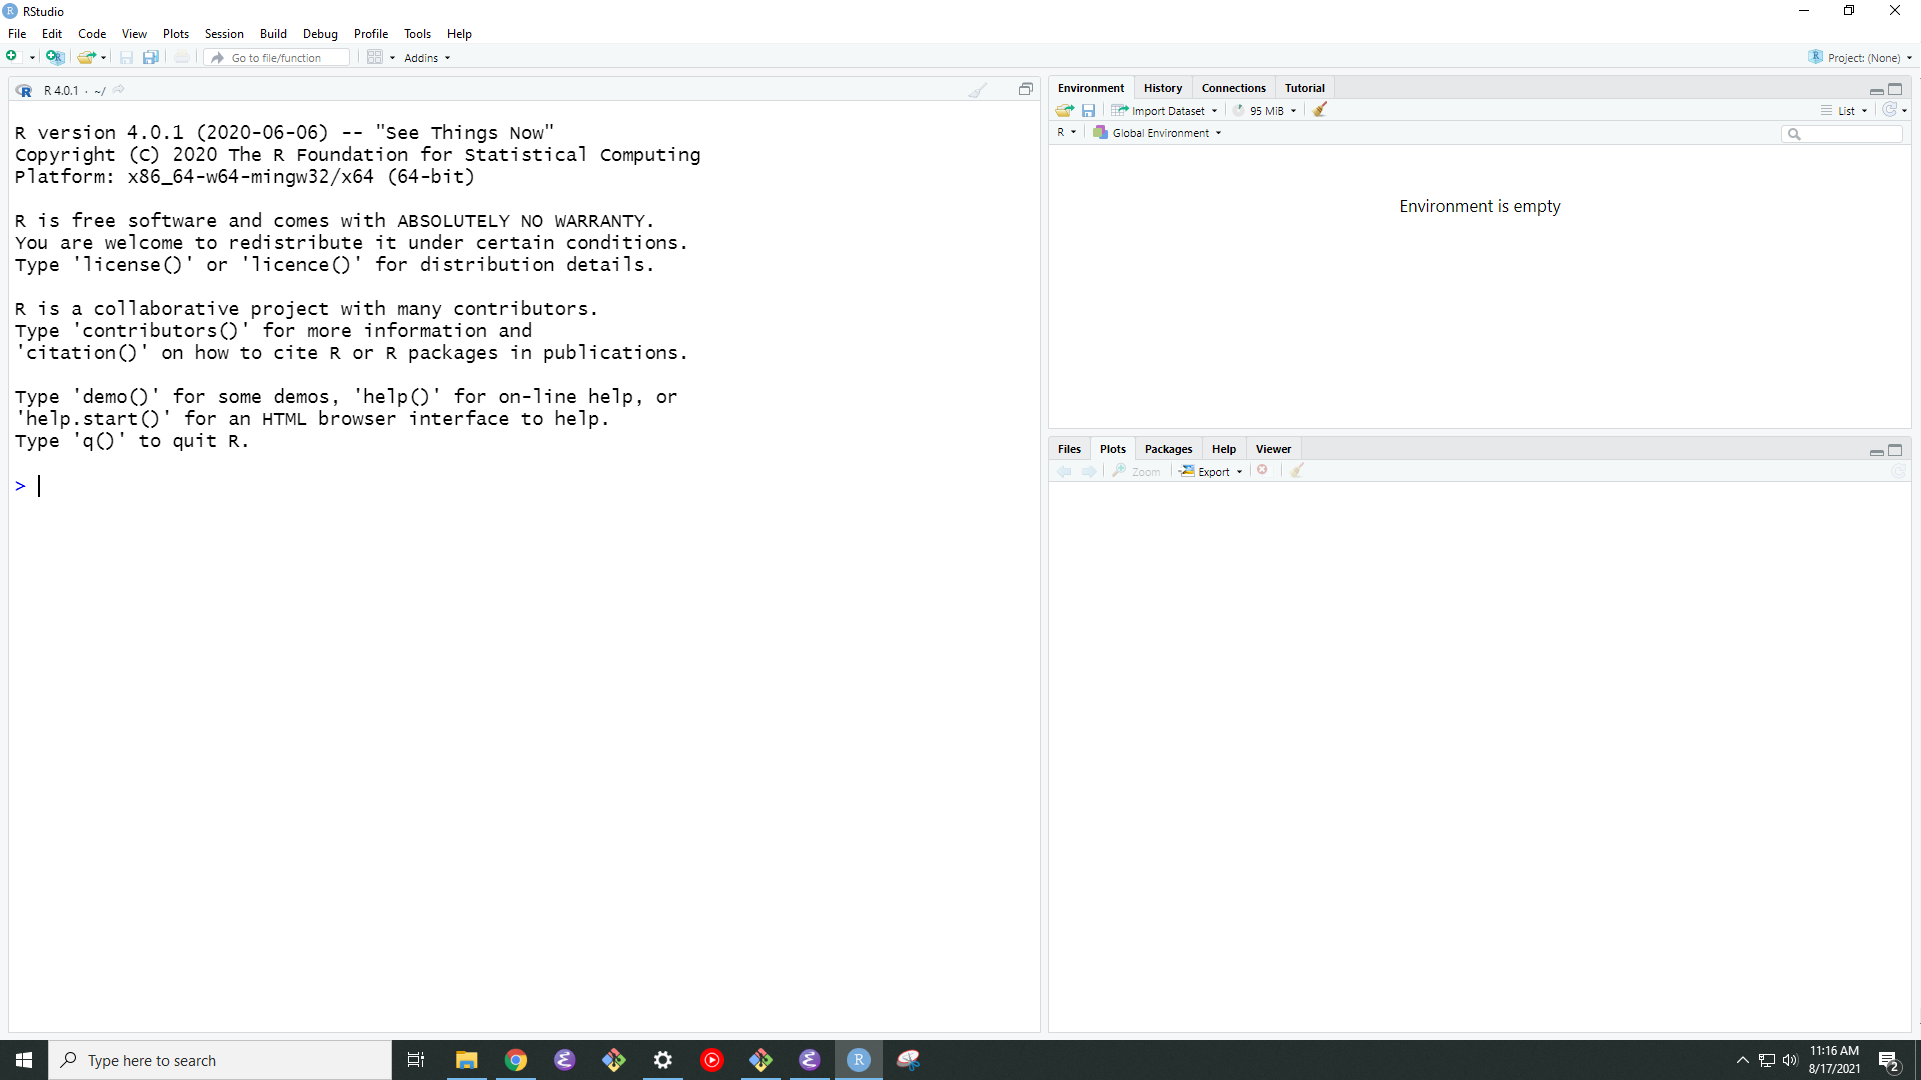
You can use the graphical user interface that comes with R, or you can run R through a system like ESS+emacs or RStudio (https://posit.co/download/rstudio-desktop/)
Most people use RStudio these days
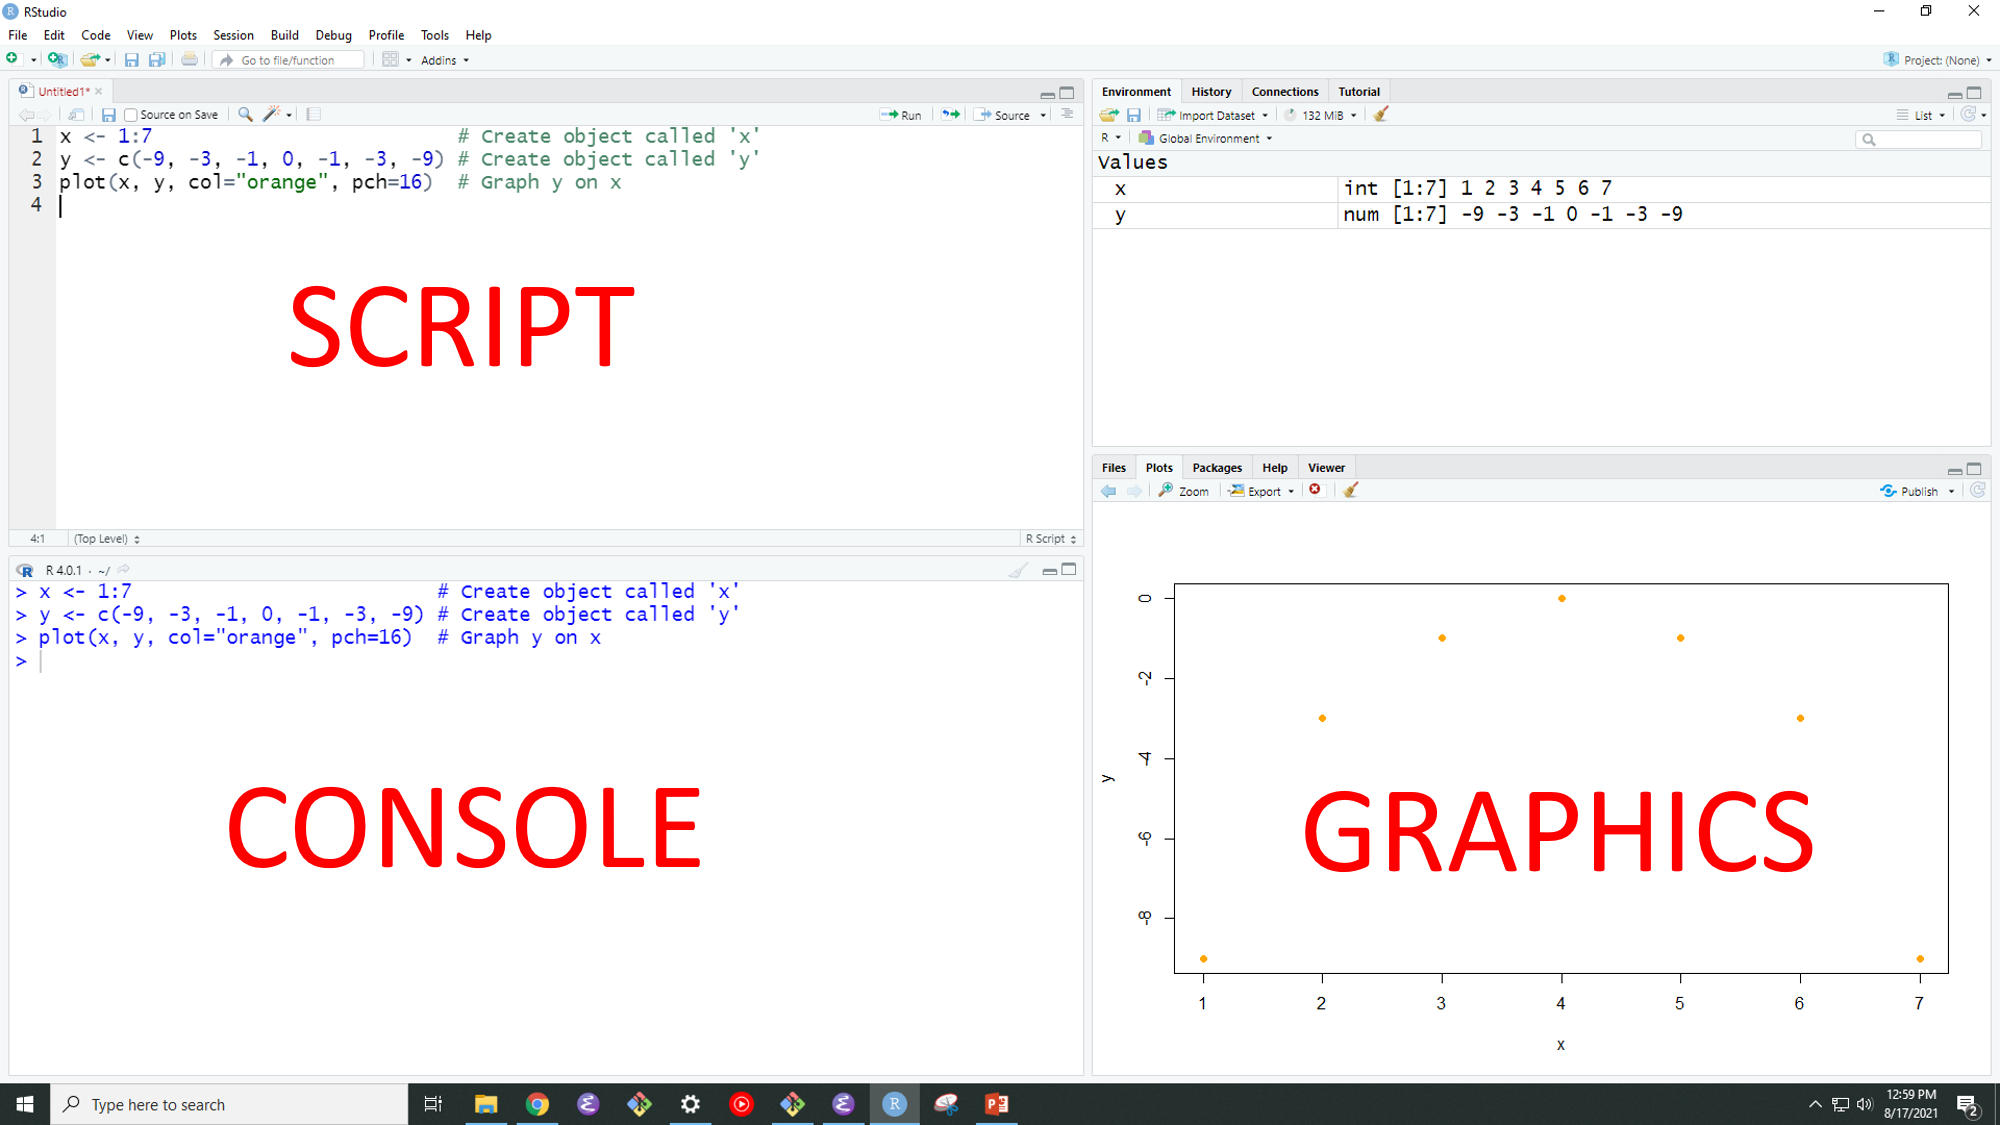
To create a new script, click: File > New File > R Script
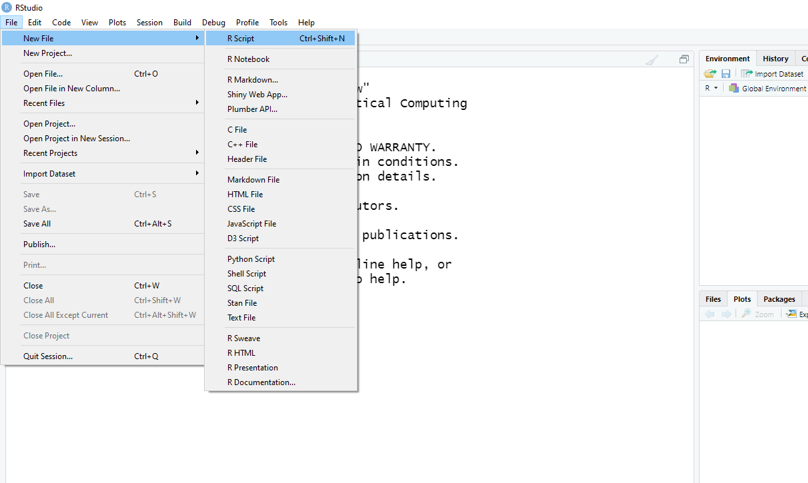
Save your script using: File > Save As

Create an object called year to hold the sequence of years.1
[1] 1950 1951 1952 1953 1954 1955 1956 1957 1958 1959 1960 1961
Note that you can use seq to create sequences in a more general way. The c function combines two or more vectors.
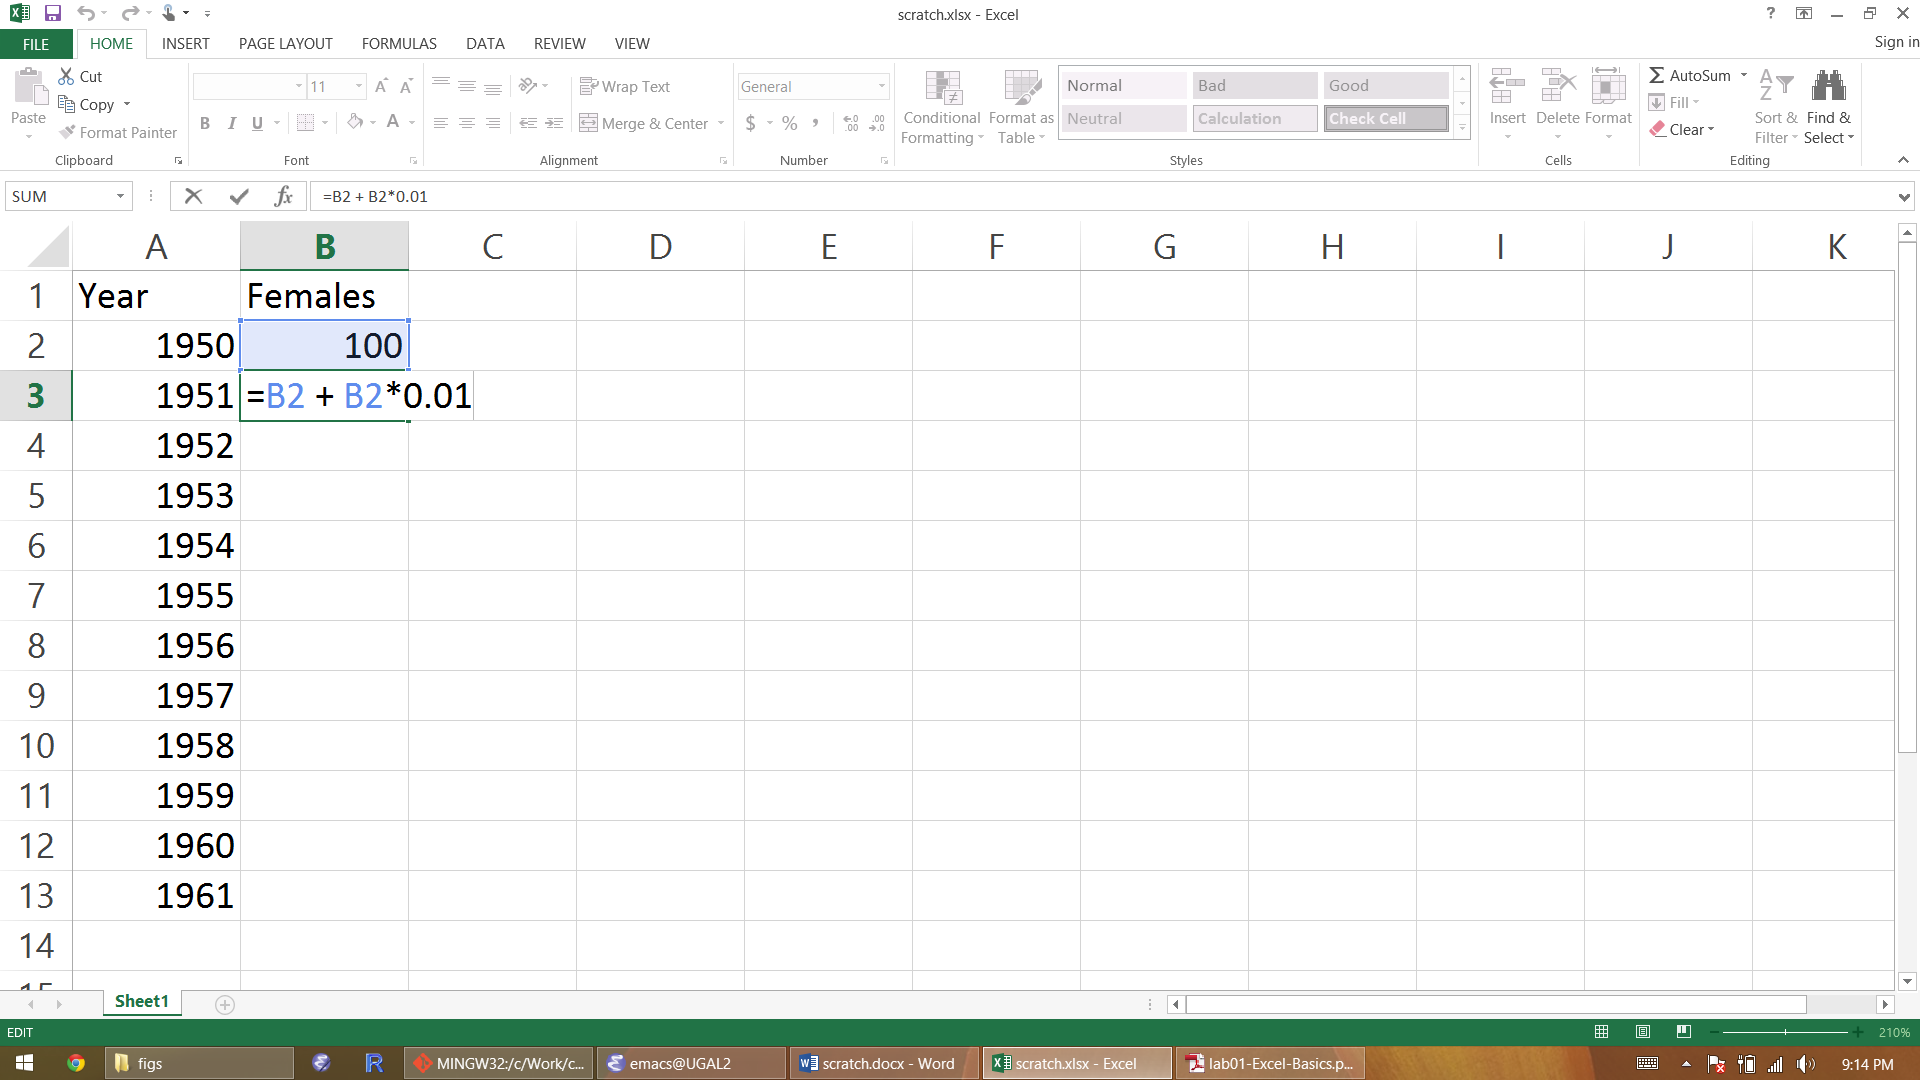
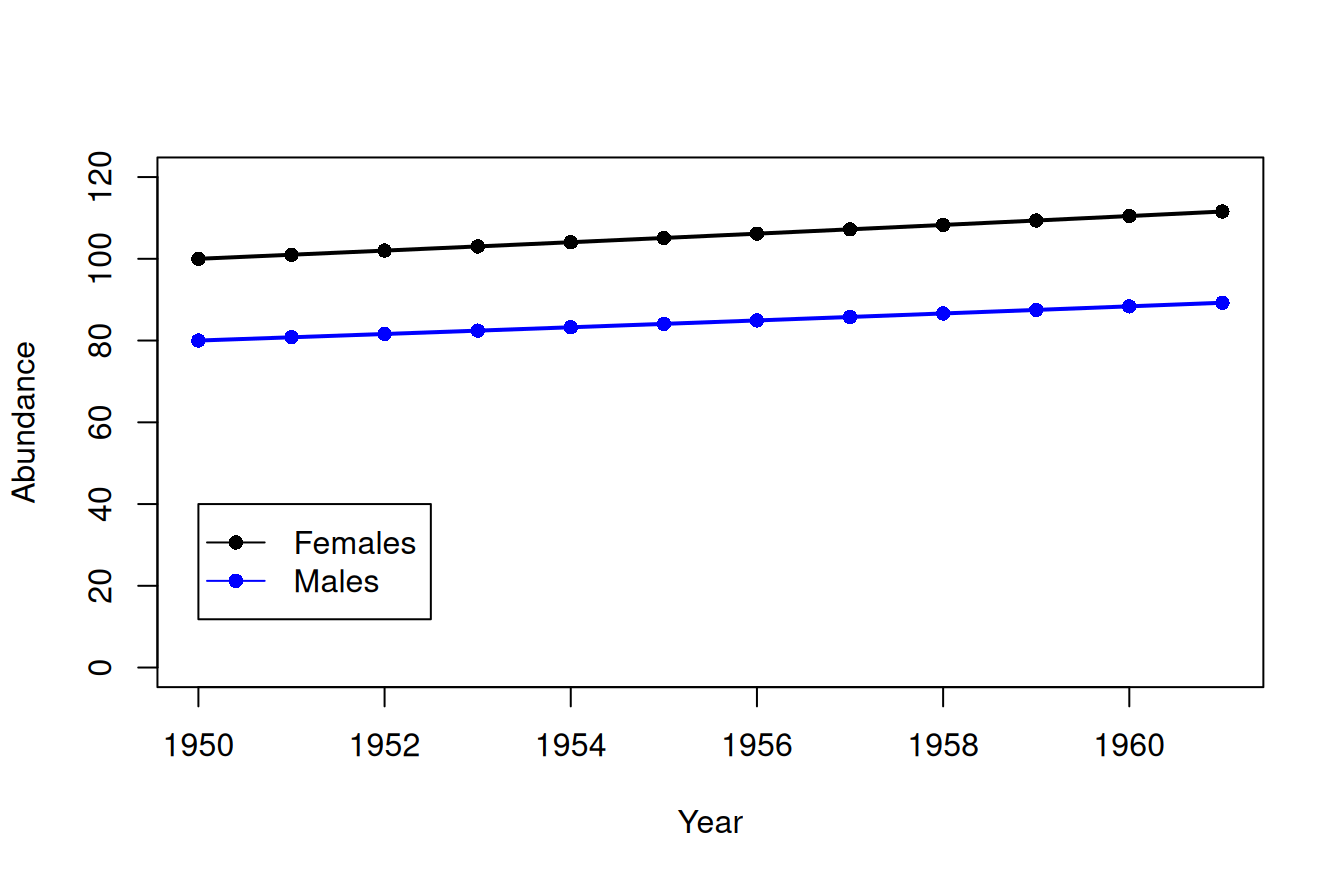
Create an empty vector to store the data on females. Set female abundance to 100 in the first year.
Use a “for loop” to compute female abundance in subsequent years.
We will use “for loops” for almost every population model that we implement in R
Put the objects in a data.frame
year females males
1 1950 100.0000 80.00000
2 1951 101.0000 80.80000
3 1952 102.0100 81.60800
4 1953 103.0301 82.42408
5 1954 104.0604 83.24832
6 1955 105.1010 84.08080
7 1956 106.1520 84.92161
8 1957 107.2135 85.77083
9 1958 108.2857 86.62854
10 1959 109.3685 87.49482
11 1960 110.4622 88.36977
12 1961 111.5668 89.25347
Another way to do the same thing, without putting objects in a data.frame:
Create an Excel file and name it “Yourlastname_Yourfirstname”.
Create the sheet shown on the next page using the techniques covered in this lab.
Use auto-fill to create the first two columns.
For the “Adults” column, use the equation shown for cells C3 through C22. Note: For cell C2, you can directly enter the value “10”.
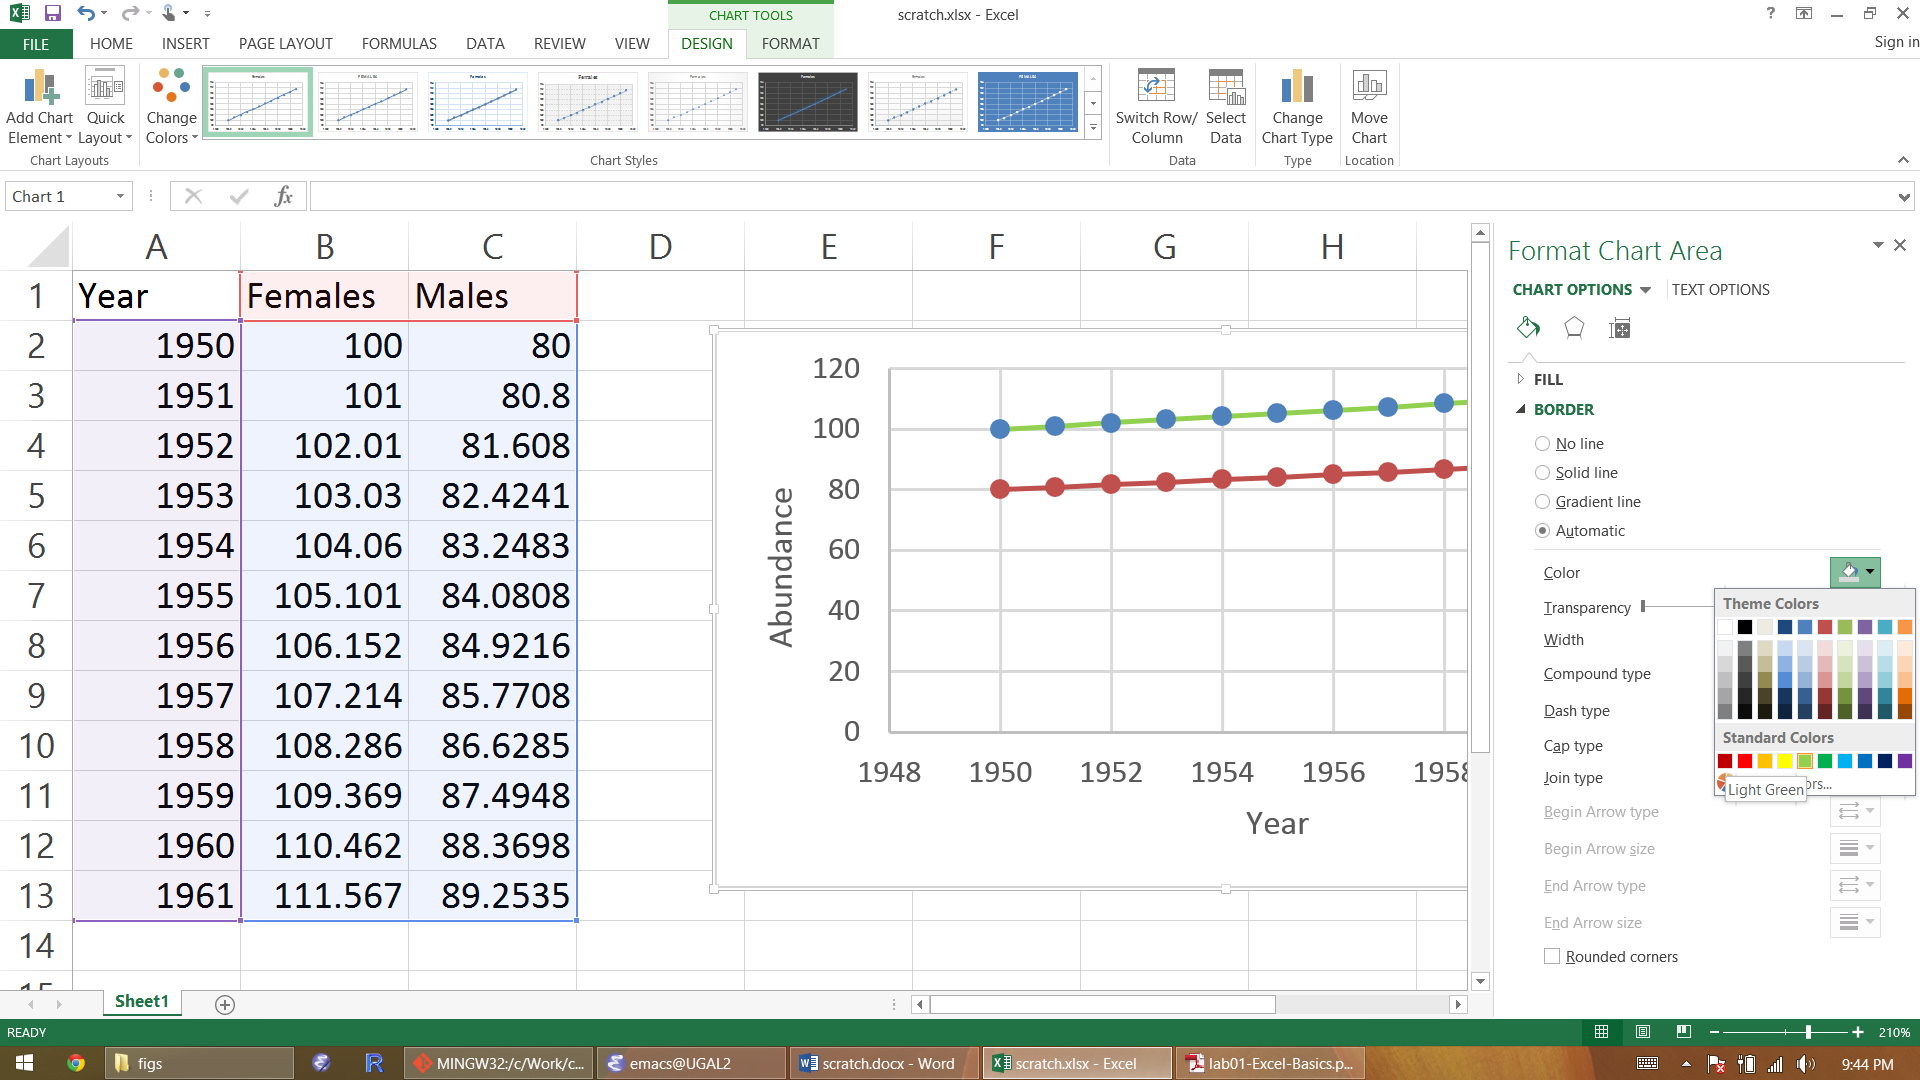
Copy “Sheet1” to a new sheet and change the color and thickness of the lines. You can pick any colors and thicknesses you want.
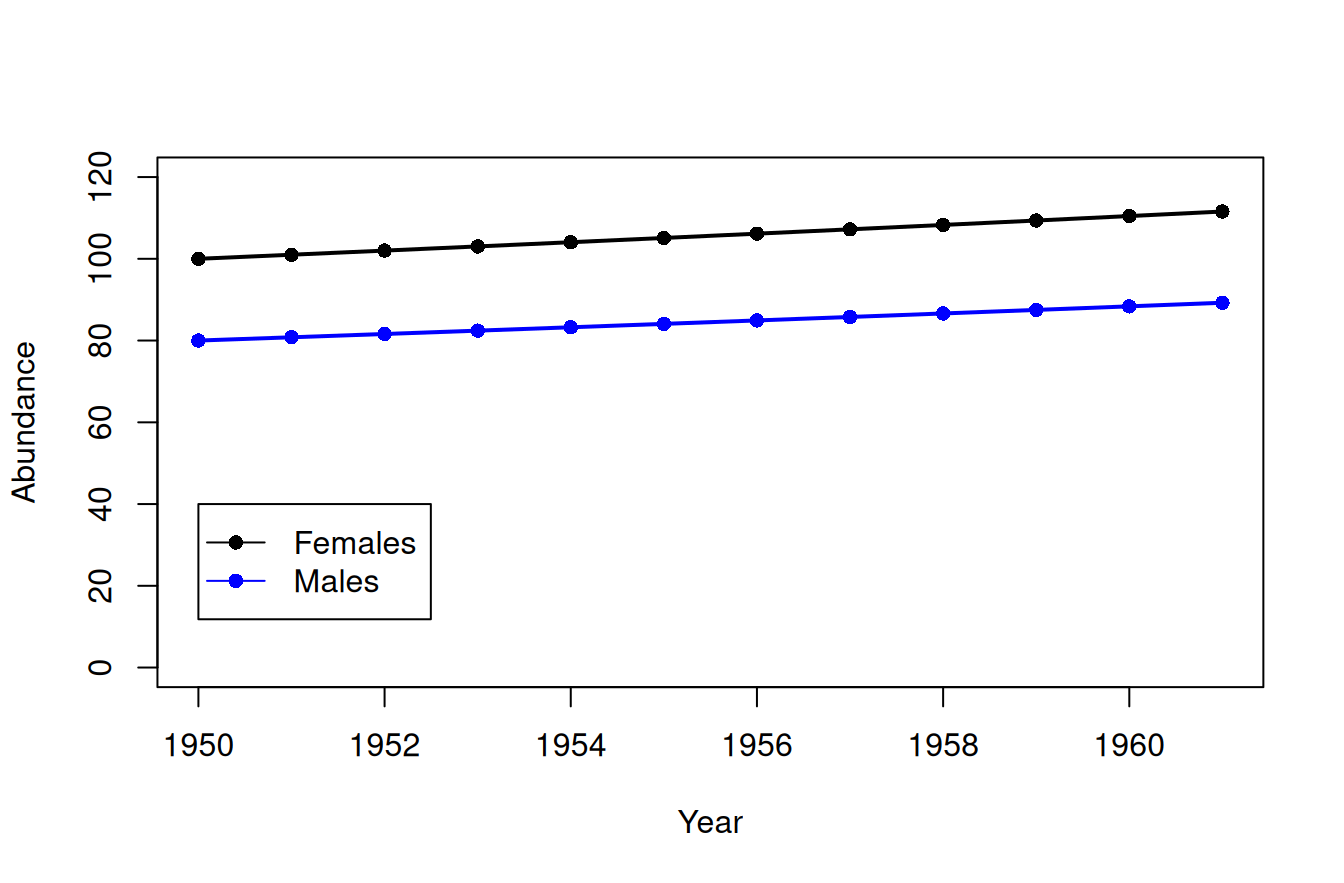
Replicate steps 1–3 using a “for loop” in a self-contained R script. Note that you will need code to create both graphs—the original one and the one with the new line color and thickness.
seq and c, like we did with the updown example earlier.Upload the Excel workbook (with both sheets) and the R script to ELC by 5:00pm on Friday.1