Capture-mark-recapture methods for abundance estimation
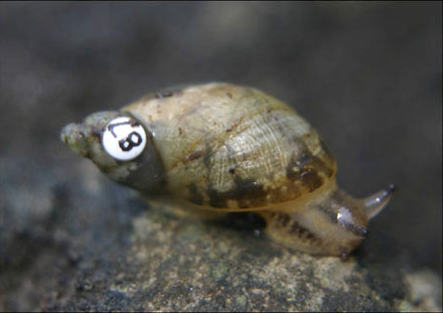
Abundance estimation

Same old equation:

\[ \hat{N} = \frac{n}{\hat{p}} \]

  • \(N\) is abundance (population size)
  • \(n\) is the number of individuals detected
  • \(\hat{p}\) is an estimate of detection probability: The probability of detecting an individual
Most methods differ in how they estimate \(p\)

Overview


Estimating \(p\)

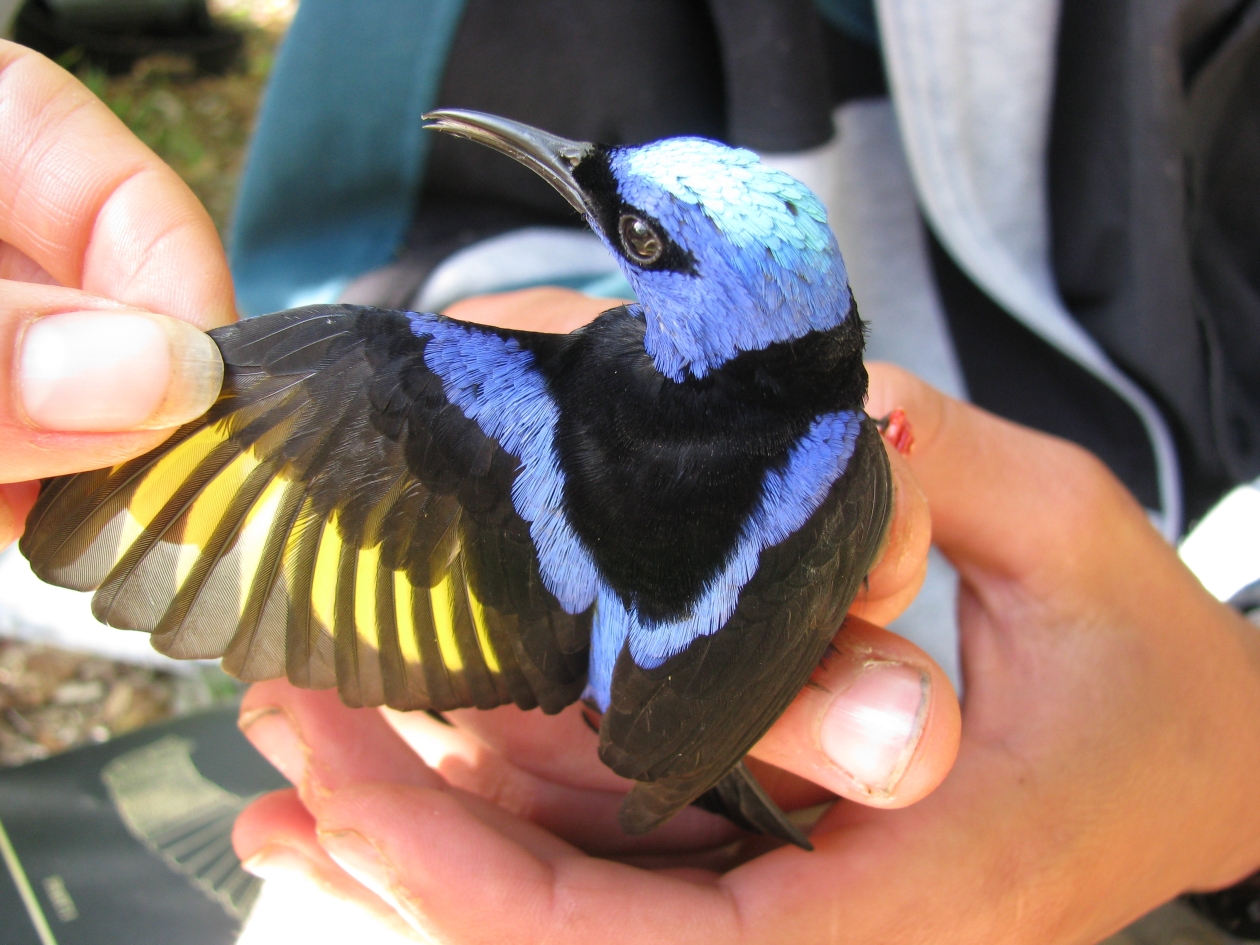
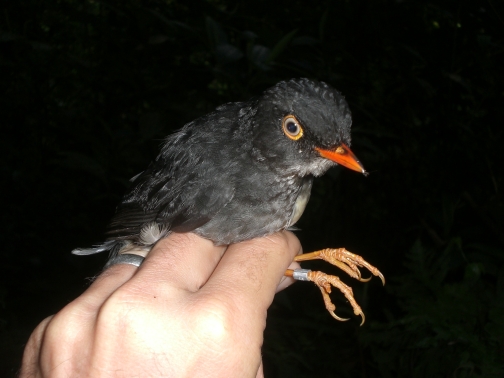
  • Set traps in a study area and mark each captured individual
  • Repeat the trapping on \(K\) occasions
  • On each occasion, mark new individuals and record recaptures
  • If capture probability is high…
    • You will detect most of the population on the first occasion
    • Most of the captures on subsequent occasions will be recaptures
  • And vice versa

Encounter histories


\(n=5\) individuals captured over 3 sampling occasions

Individual Occasion 1 Occasion 2 Occasion 3
1 0 0 1
2 1 1 0
3 1 1 1
4 1 0 0
5 0 1 0

These data tell us about \(p\) and hence \(N\). Estimation is usually acheived using maximum likelihood methods.

Lincoln-Peterson

Lincoln-Peterson Method

The original method was first used by Pierre-Simon LaPlace to estimate the human population in France.
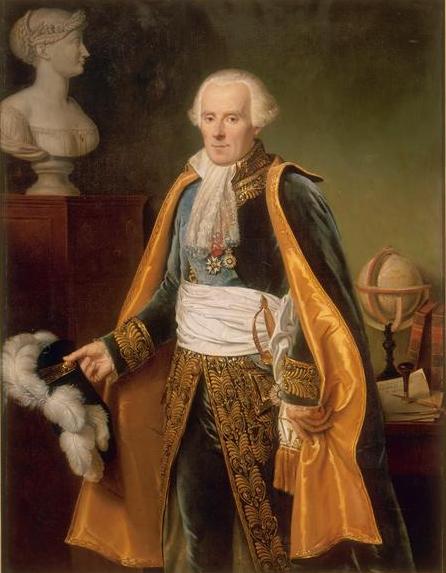
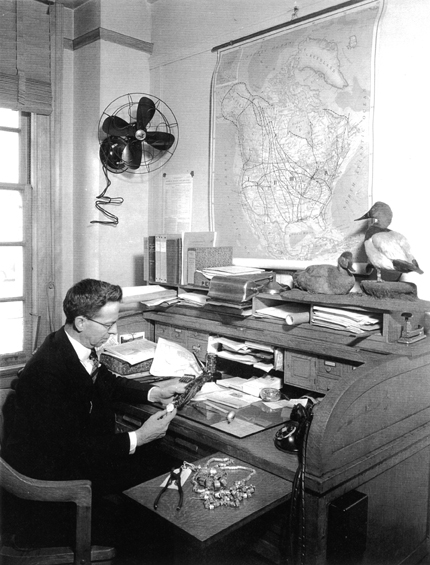
Later it was used by Lincoln (shown above) and Peterson to estimate fish and wildlife populations.

Lincoln-Peterson Study Design

  • There are only 2 capture occasions
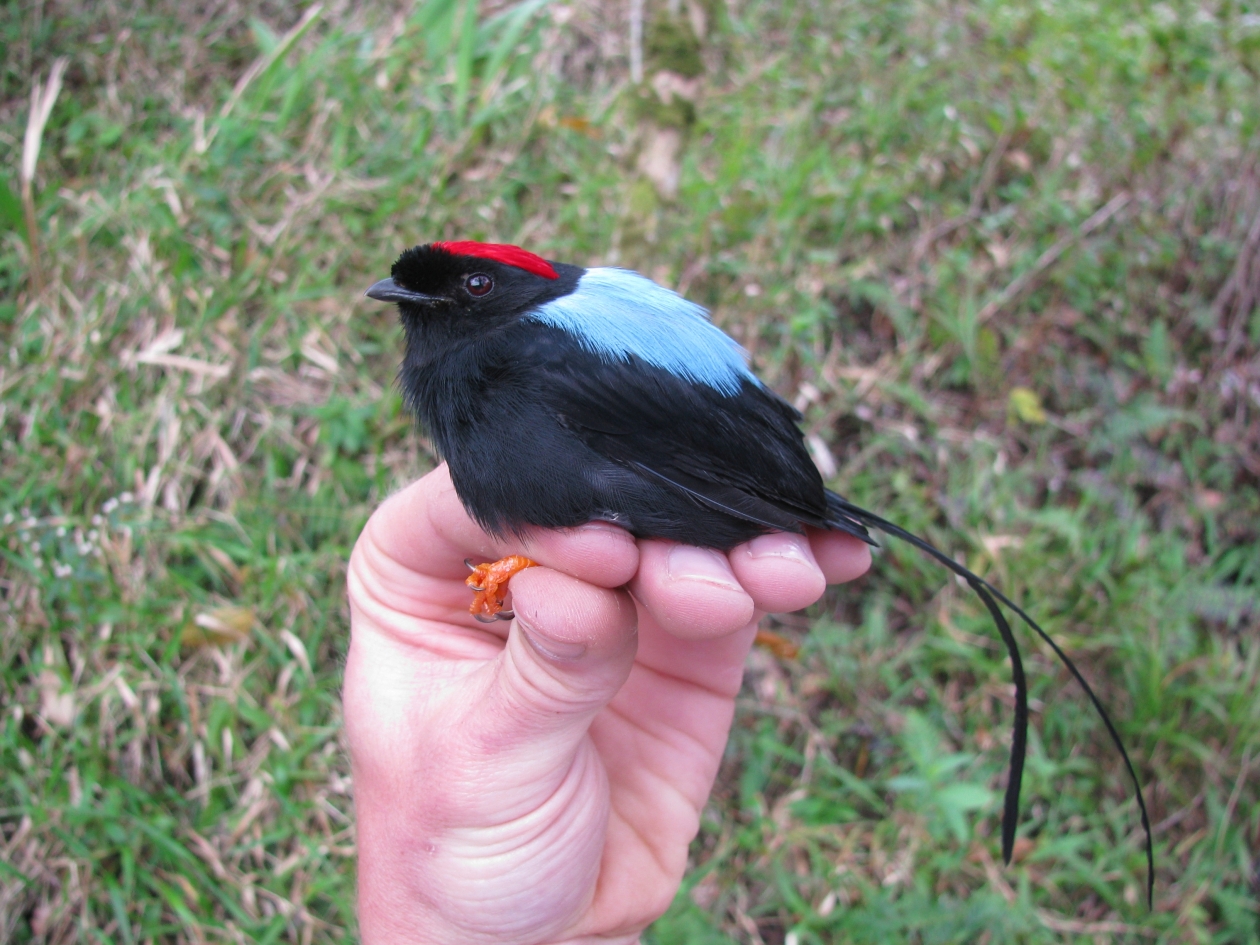
  • On the first, \(n_1\) animals are captured and marked
  • On the second, \(n_2\) animals are captured and \(m_2\) of them are recaptures
Lincoln-Peterson Abundance Estimator


How can we use \(n_1\), \(n_2\), and \(m_2\) to estimate \(N\)?

\[ \frac{n_1}{N} = \frac{m_2}{n_2} \]

And so…

\[ \hat{N} = \frac{n_1n_2}{m_2} \]

Lincoln-Peterson Assumptions


  • Population closure
    • No births
    • No deaths
    • No immigration or emigration
  • All individuals are assumed to have the same capture probability
  • No tag loss or mis-identification

\(K\)-sample CMR

K-sample CMR

Using more than 2 sampling occasions has many advantages, including the ability to account for:

  • Temporal variation
  • Behavioral effects
    • Trap happiness
    • Trap shyness
  • Individual heterogeneity
  • Combinations of the above

Common models

Model Description
\(M_0\) The most basic model in which \(p\) and \(c\) are constant
\(M_t\) \(p\) differs among sampling occasions and \(p_t=c_t\).
\(M_b\) Behavioral response model in which \(p\) and \(c\) differ. Can describe trap happiness or trap shiness.
\(M_{tb}\) A combination of models \(M_t\) and \(M_b\).


where

\(p =\) capture probability
\(p_t =\) capture probability on occasion \(t\)
\(c =\) recapture probability

Removal sampling

Removal sampling


Video

Removal sampling

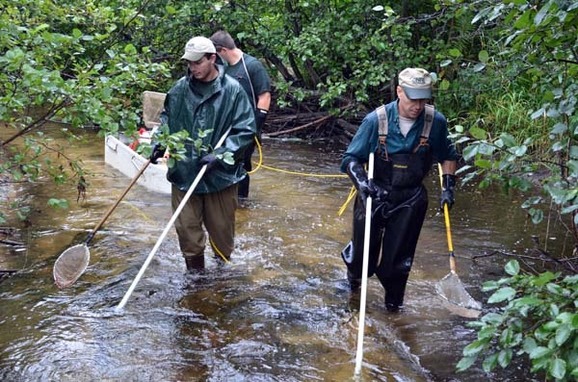
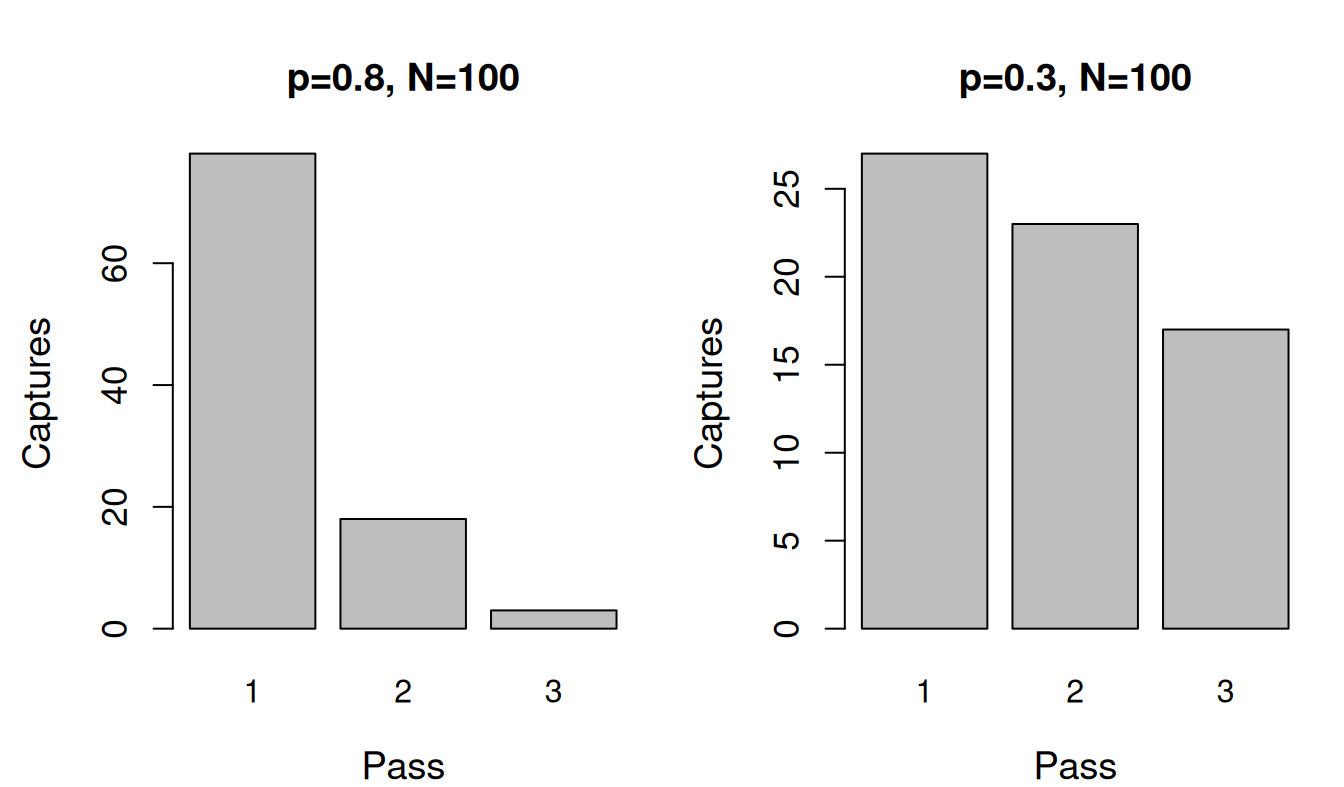
Suppose you conduct several electrofishing passes on a single stream section, and you remove individuals on each pass.

Eventually you should deplete the population.

The number of captures you would expect on each pass:

Pass Expected captures
1 \(pN\)
2 \(p(1-p)N\)
3 \(p(1-p)^2N\)
4 \(p(1-p)^3N\)
\(\vdots\) \(\vdots\)
K \(p(1-p)^{K-1}N\)

Example

The rate at which the population is depleted tells us about \(p\), and therefore how many individuals we missed.
Estimating density

Lingering questions

  • How do we convert abundance to density?
  • What is the area surveyed?
  • How do we model spatio-temporal variation in density?
Summary


Capture-recapture methods use information about recapture rates to estimate capture probability and abundance.


Modern methods use camera traps or DNA sampling techniques to collect non-invasive capture-recapture data and estimate density and vital rates.

Assignment


Read Chapter 11