Mark-recapture methods for estimating survival and recruitment
Accounting for imperfect detection
Suppose we mark and release \(R\) individuals, and then recapture \(m\) of them on the second occasion. How do we estimate survival probability?
If capture probability (\(p\)) was 1, we could use: \[ \hat{S} = \frac{m}{R} \]
But when \(p<1\), \(m\) is some fraction of the number actually alive (\(M\)), so we have to estimate \(p\) and \(M\) to estimate \(S\):
\[ \hat{S} = \frac{\hat{M}}{R} \]
where
\[ \hat{M} = \frac{m}{\hat{p}} \]
Tag recovery models
Tag recovery models
Purpose
Estimate survival from recovered tags.
Benefit
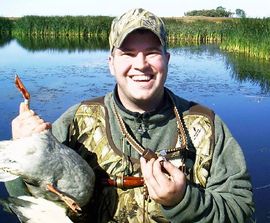
Because hunters are just about everywhere, we don’t have to worry about animals leaving “the study area” and we can estimate actual survival.
Tag recovery models
Design
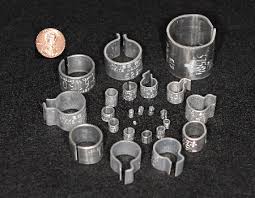
- Animals are marked and released
- Hunters or anglers report tags from harvested individuals
- Desirable to have at least 5 releases
Data
Three release years followed by 3 years of recoveries:
| Number released | Period recovered | ||
|---|---|---|---|
| 1 | 2 | 3 | |
| \(R_1\) | \(m_{1,1}\) | \(m_{1,2}\) | \(m_{1,3}\) |
| \(R_2\) | \(m_{2,2}\) | \(m_{2,3}\) | |
| \(R_3\) | \(m_{3,3}\) | ||
Tag recovery models
Expected values
| Period released | Number released | Period recovered | ||
|---|---|---|---|---|
| 1 | 2 | 3 | ||
| 1 | \(R_1\) | \(R_1f_1\) | \(R_1S_1f_2\) | \(R_1S_1S_2f_3\) |
| 2 | \(R_2\) | \(R_2f_2\) | \(R_2S_2f_3\) | |
| 3 | \(R_3\) | \(R_3f_3\) | ||
Parameters
- Survival (\(S\))
- Recovery rate (\(f\))
Tag recovery models
Assumptions
- Sample is representative of population
- No tag loss, mis-identification, etc
- All animals have common survival and recovery rates
- Fates are independent
Extensions
- Age-specific models
- Grouping variables
- Time variables
- Habitat variables
CJS model
Cormack-Jolly-Seber (CJS) model
Purpose
Estimate survival and capture probability from capture-recapture data.
Design
A random sample of animals is marked and followed over many periods (eg, years).
Notes
- When permanent emigration is possible, we can’t be sure if an animal died or left study area
- So we often have to estimate apparent survival (\(\Phi\)) instead of actual survival (\(S\))
- Apparent survival is the probability that an individual survives and does not permanently emigrate out of the study area
CJS capture histories
In CJS studies, we ignore the leading zeros in the capture histories because we aren’t interested in how animals enter the sample.
All we care about is survival, so we “condition” on first encounter.
| Year 1 | Year 2 | Year 3 | |
|---|---|---|---|
| Animal 1 | 1 | 0 | 0 |
| Animal 2 | 1 | 0 | |
| Animal 3 | 1 | ||
| Animal 4 | 1 | 1 | 1 |
| Animal 5 | 1 | 1 |
CJS capture histories
Estimation is accomplished by finding the values of \(p\) and \(\Phi\) that best align the expected values with the observed capture histories.
| Capture history | Expected values |
|---|---|
| 111 | \(\Phi_1p_2\Phi_2p_3\) |
| 110 | \(\Phi_1p_2(1-\Phi_2p_3)\) |
| 101 | \(\Phi_1(1-p_2)\Phi_2p_3\) |
| 100 | \((1-\Phi_1)+\Phi_1(1-p_2)(1-\Phi_2p_3)\) |
CJS model
Assumptions
- Same as tag-recovery, plus
- Instantaneous recapture and release of animals
- Homogeneity of capture and survival probabilities for marked animals
- All emigration is permanent
Model can be extended to accommodate variation due to…
- Age
- Sex
- Habitat
- Geographical regions
JS model
Jolly-Seber (JS) model
Purpose
Estimate survival, recruitment, abundance, and capture probability from capture-recapture data.
Design
Randomly sample the population during every period and mark all newly captured unmarked animals.
Examples
- Constant-effort mist-netting
- Long-term small mammal trapping
Recruitment in the Jolly-Seber model
Recruitment in JS models is defined as the per-capita rate at which new individual enter the population.
If immigration is not possible, recruitment is equivalent to fecundity.
Note that in other applications, recruitment is defined as the product of the birth rate and the probability of surviving to maturity.
JS capture histories
We no longer “condition” on first encounter – Instead, we use all the data.
The leading zeros provide information about when individuals are recruited into the population.
| Year 1 | Year 2 | Year 3 | |
|---|---|---|---|
| Animal 1 | 1 | 0 | 0 |
| Animal 2 | 0 | 1 | 0 |
| Animal 3 | 0 | 1 | 1 |
| Animal 4 | 1 | 1 | 1 |
| Animal 5 | 0 | 1 | 1 |
Jolly-Seber model
Assumptions
- All the assumptions of CJS model, plus…
- Every animal — marked or unmarked — has the same probability of capture
The standard JS model doesn’t work very well, but it is extremely powerful when combined with the robust design.
Robust design
Robust design
Purpose
Relax assumptions and increase precision by collecting more data.
Key concept
We now have two types of sampling periods:
- Primary sampling periods: the population is assumed to be open
- Secondary sampling periods:the population is assumed to be closed
Robust design capture histories
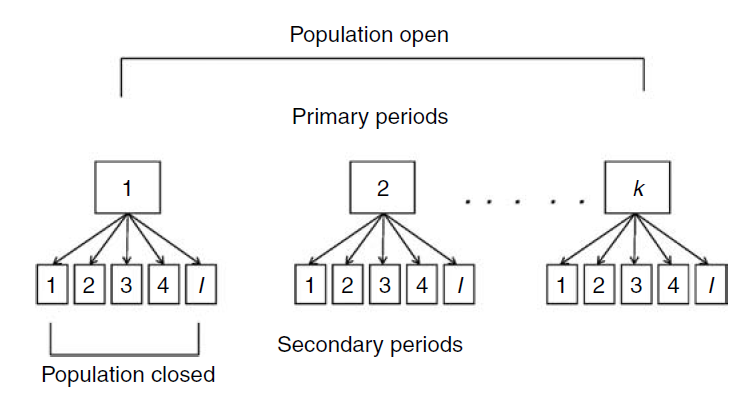
Example with 2 primary periods and 3 secondary periods:
| Primary period 1 | Primary period 2 | ||||||
|---|---|---|---|---|---|---|---|
| 2-4 | Day 1 | Day 2 | Day 3 | Day 1 | Day 2 | Day 3 | |
| Animal 1 | 0 | 0 | 1 | 1 | 0 | 0 | |
| Animal 2 | 1 | 0 | 1 | 1 | 1 | 1 | |
| Animal 3 | 0 | 0 | 0 | 1 | 0 | 0 | |
| Animal 4 | 1 | 1 | 1 | 0 | 0 | 0 | |
| Animal 5 | 0 | 0 | 0 | 1 | 1 | 0 | |
Summary
| Method | Data | Survival | Recruitment | Abundance |
|---|---|---|---|---|
| Tag recovery | Recoveries | Yes | No | No |
| CJS | Mark-recap | Yes\(^1\) | No | No |
| JS | Mark-recap | Yes\(^1\) | Yes | Yes |
Each of these three methods is widely used in practice. The best option depends on the objectives.
\(^1\) Apparent survival